Home / Research / Data / India and the Russian-oil tariff dataset
Dataset · India and the Russian-oil tariff
India and the Russian-oil tariff dataset
The signals log, US imports from India by sector with today's duty rates, India's Russian crude series and the sector exposure table behind the tracker and the brief.
- Tables
- 15
- Rows
- 6,106
- Coverage
- 1001–9982
- Updated
- 4 October 2026
- Format
- CSV, UTF-8
- Licence
- Free with attribution
Download all (98 KB, zip) Method note The research series
Files
| Table | Period | Rows | Columns | Source | Download |
|---|---|---|---|---|---|
| Signals log Every official action, statement, market figure and business reaction since the 2025 duty: date, who, what happened, their words, and the source. |
2025–2031 | 45 | 8 | White House, Federal Register, USTR, MEA, PIB, press | CSV |
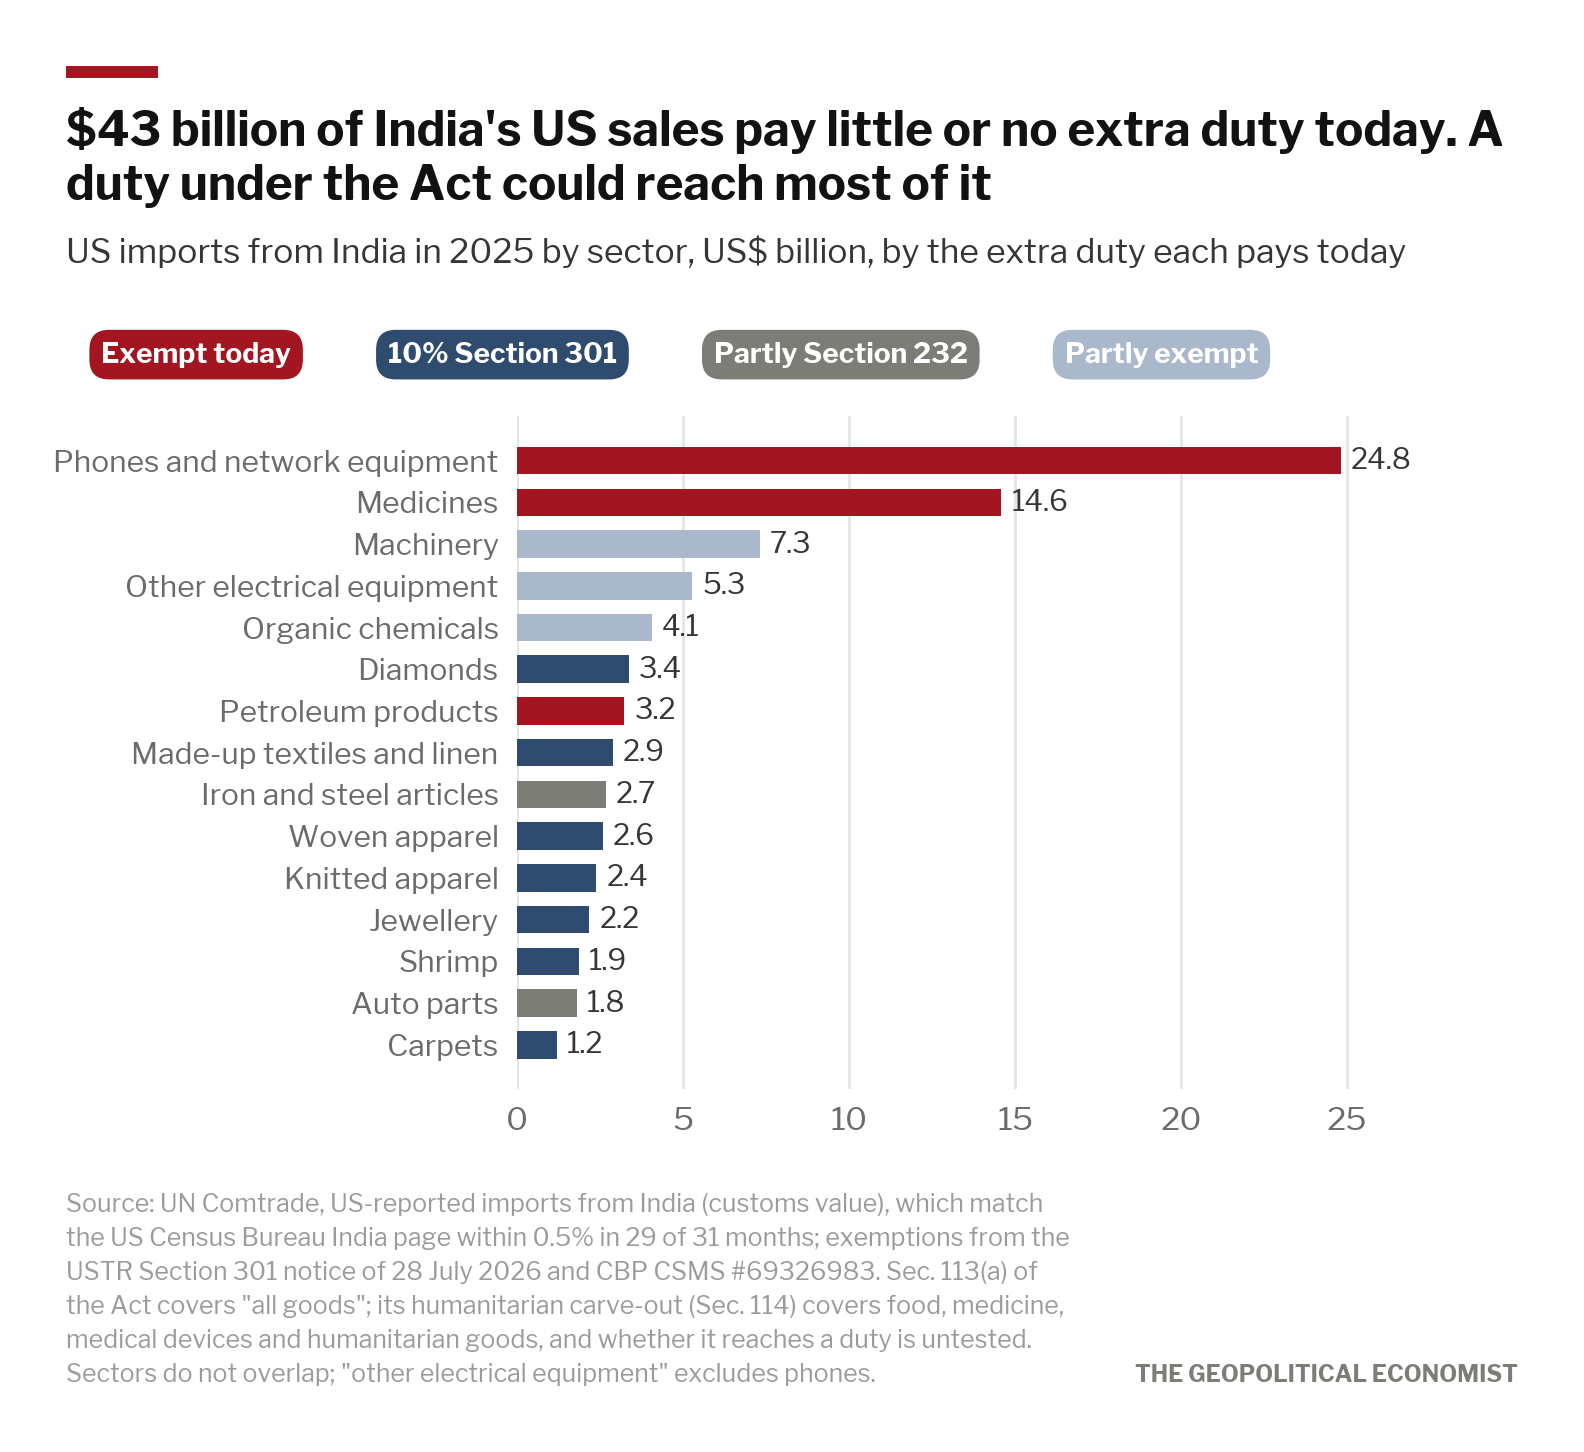
| Sector exposure table Eighteen export sectors: US imports from India in 2025, India's rank among US suppliers, the share of each sector's exports that go to the US, the change under the 2025 duty, the extra US duty today and rivals' duty, and an exposure rating by a fixed rule. |
18 | 14 | UN Comtrade; India's TradeStat; USTR, CBP and PIB for duties | CSV | |
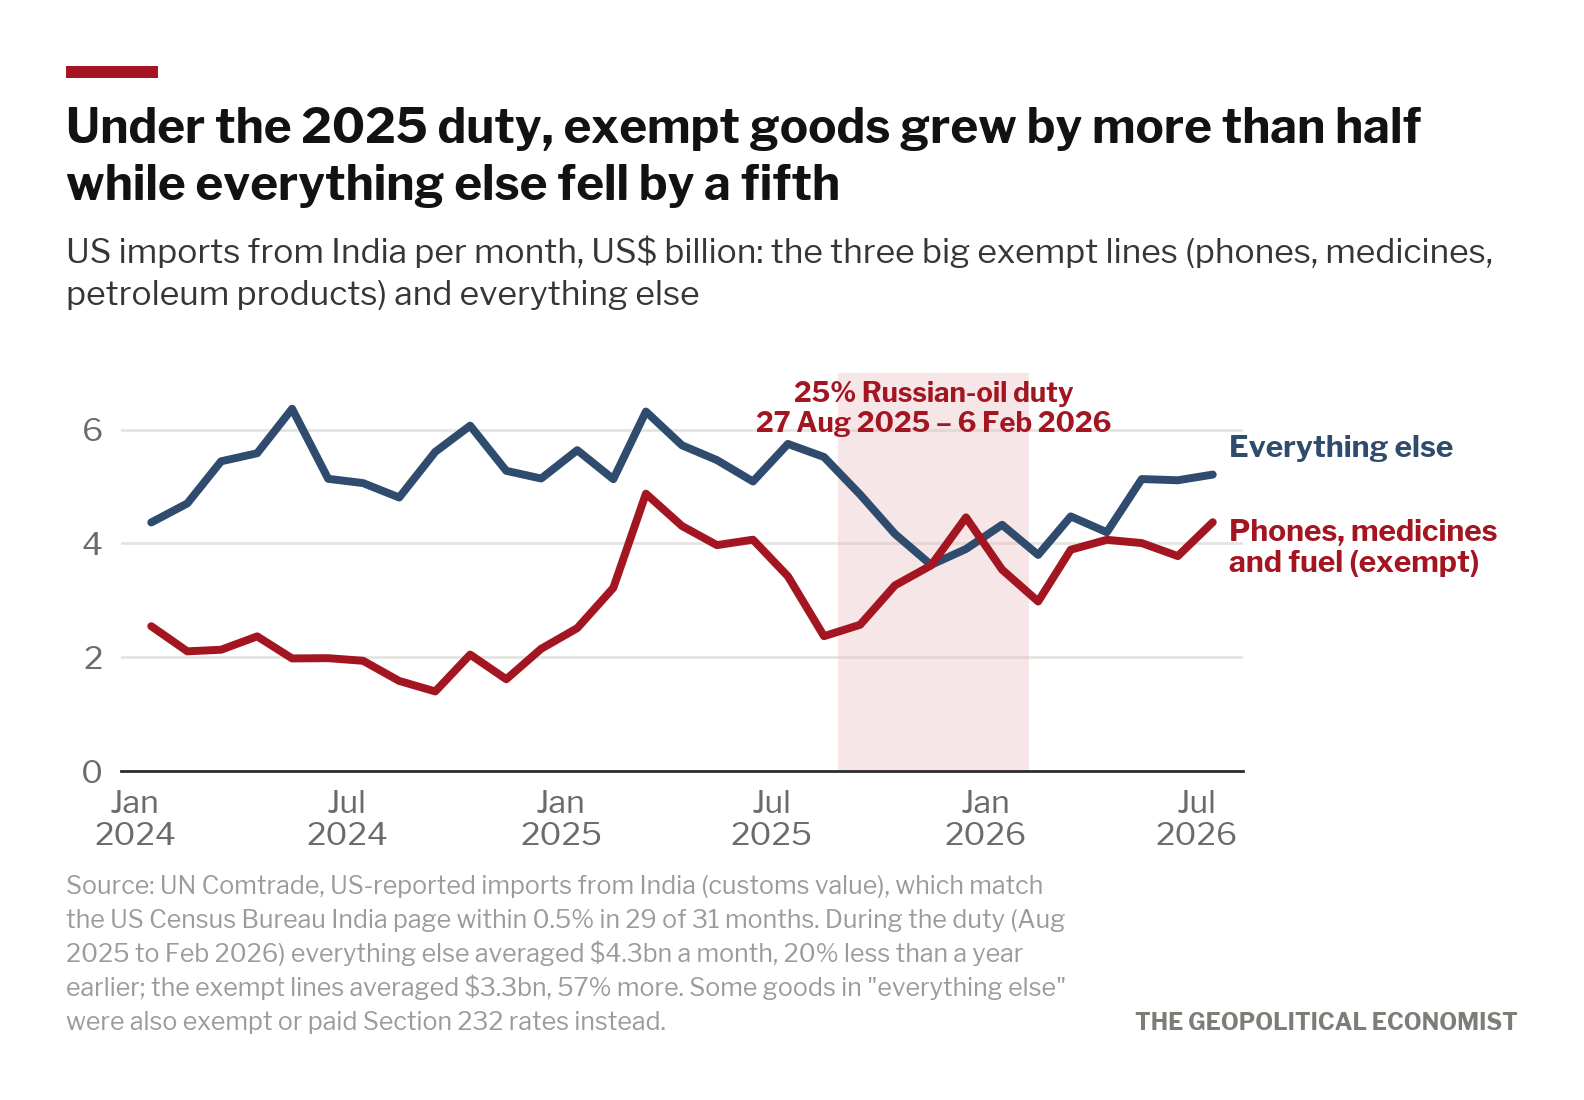
| US imports from India by month January 2024 to July 2026, at customs value, checked against the US Census Bureau's India page. |
2024–2026 | 31 | 5 | UN Comtrade (US-reported imports), checked against the US Census Bureau | CSV |
| US imports from India by sector and month The eighteen export sectors in the brief, each month. |
2024–2026 | 558 | 5 | UN Comtrade (US-reported imports), checked against the US Census Bureau | CSV |
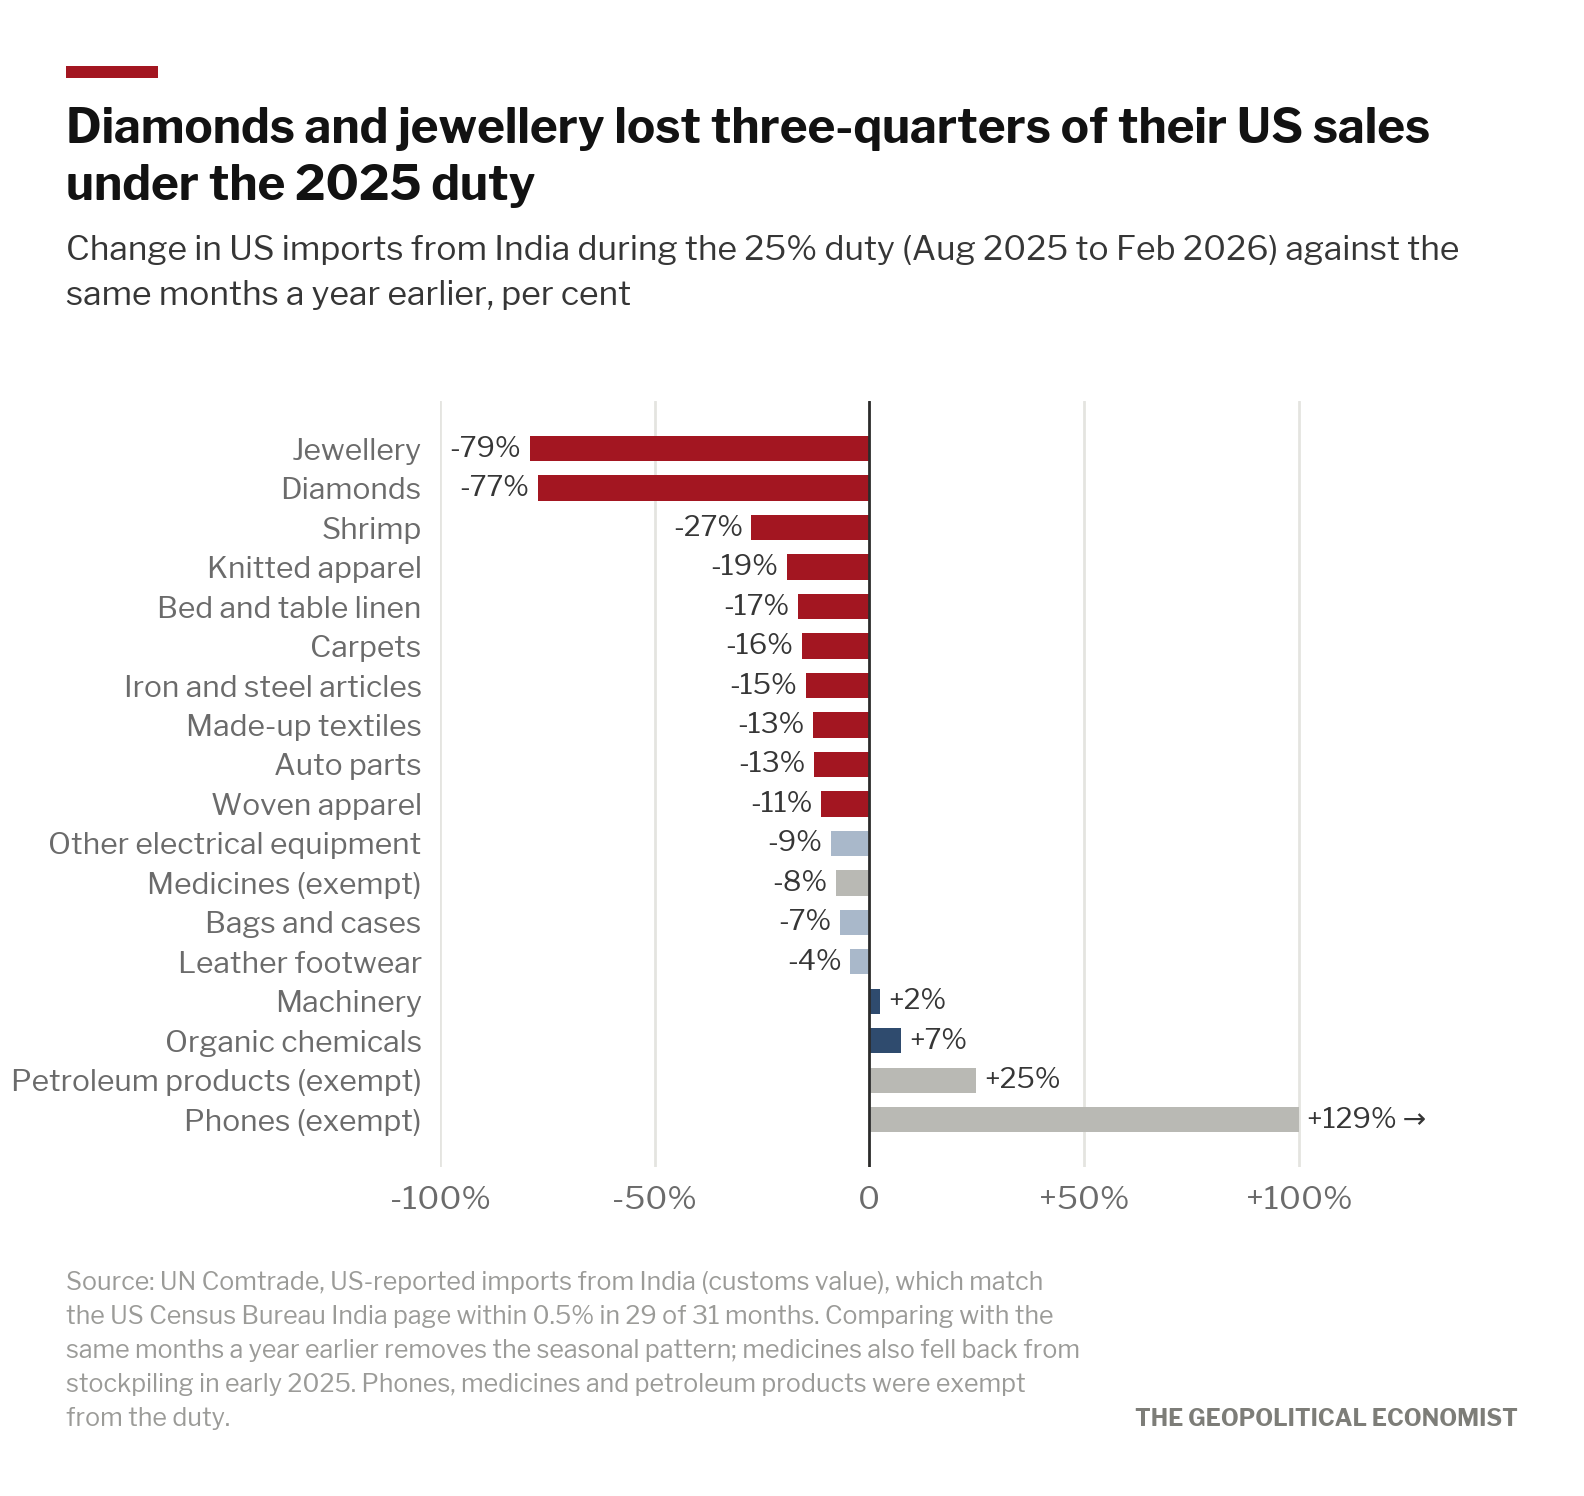
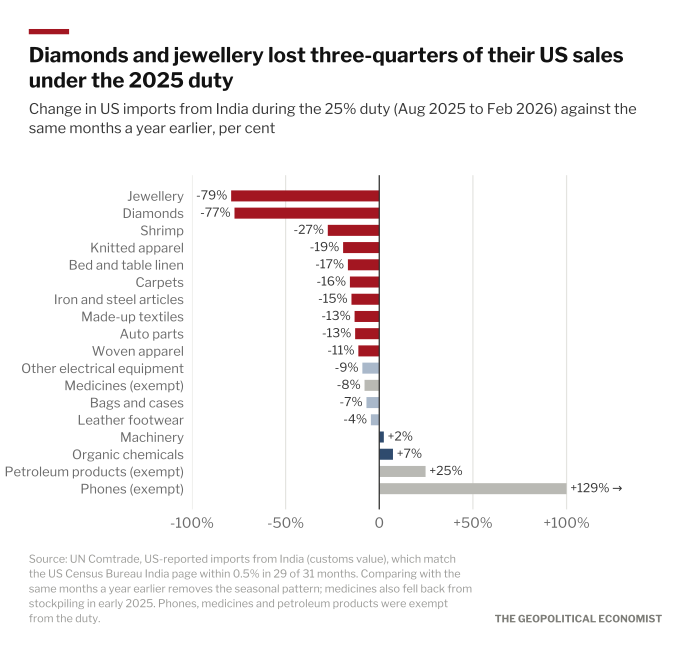
| Sector change in 2025-26 How much each sector's US sales changed from August 2025 to February 2026, when non-exempt Indian goods paid 50% in extra duties, against the months before and a year earlier. |
1001–9982 | 105 | 12 | UN Comtrade (US-reported imports), checked against the US Census Bureau | CSV |
| India's exports to the US by month Commerce Ministry (TradeStat) figures, Jan 2024 to Jul 2026. |
2024–2026 | 31 | 6 | Commerce Ministry TradeStat (DGCI&S) | CSV |
| US share of each sector's exports TradeStat, FY2024-25, FY2025-26 and Apr–Jul of each year. |
2026 | 72 | 7 | Commerce Ministry TradeStat (DGCI&S) | CSV |
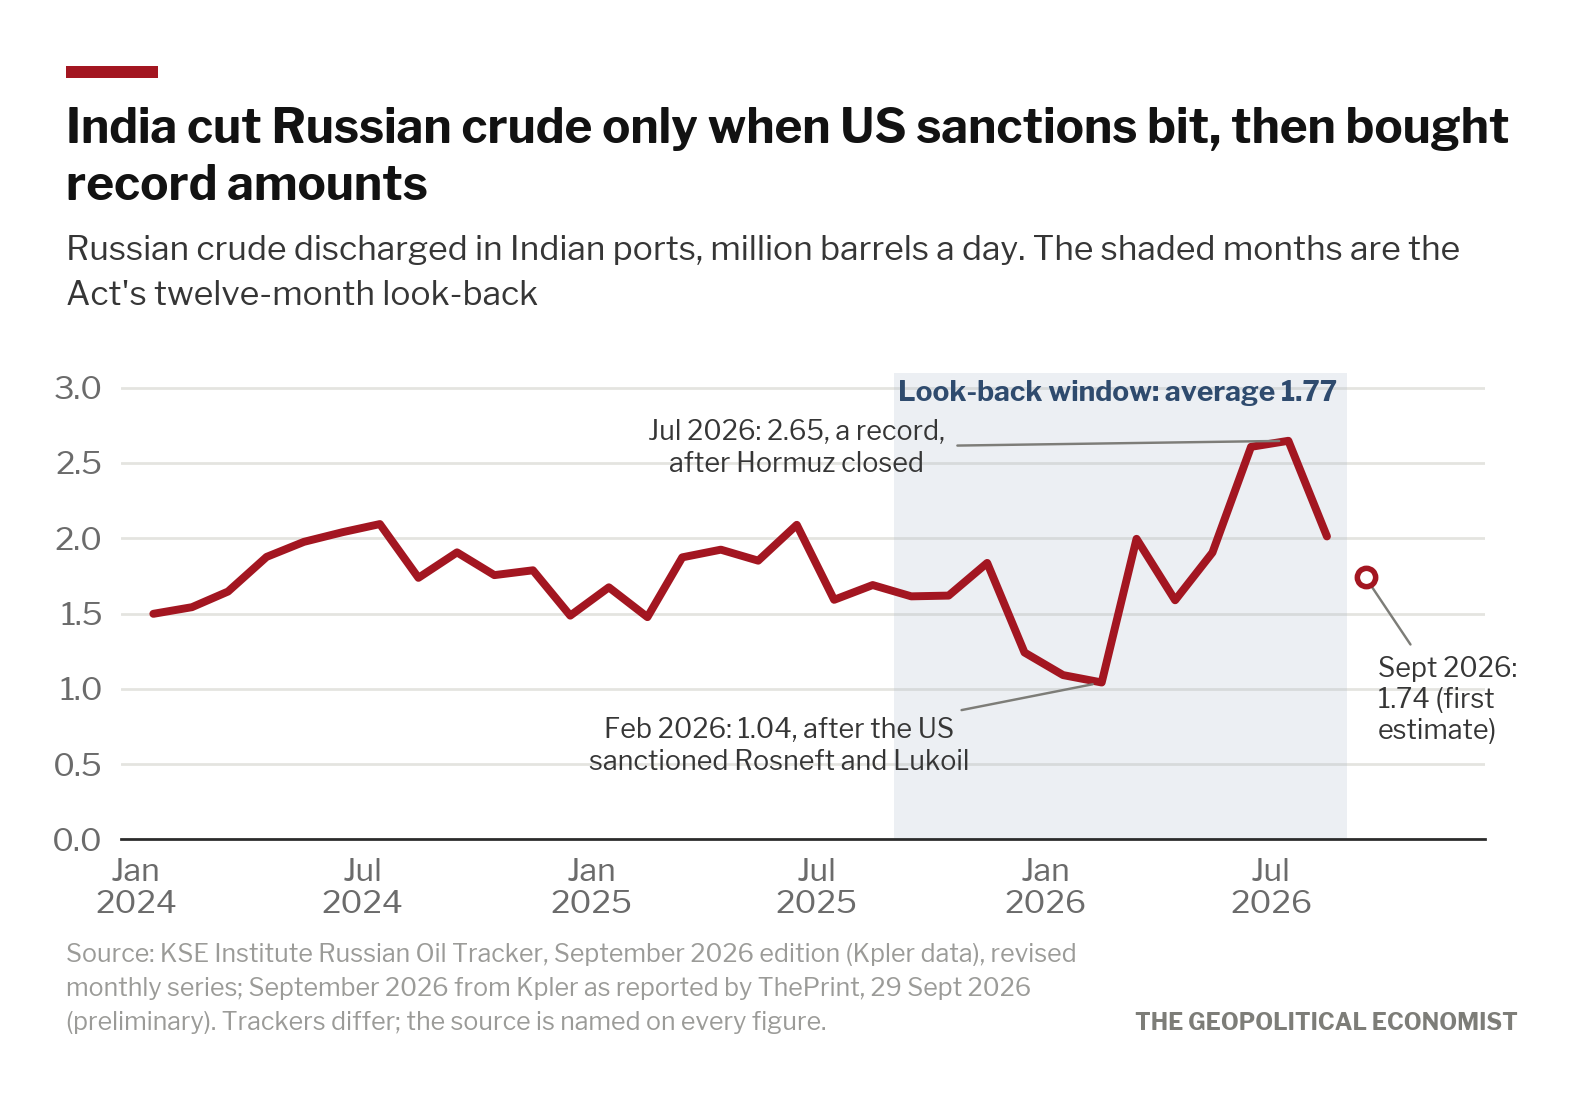
| India's Russian crude by month Barrels a day and share of imports by month, 2022 to September 2026, with a column saying what each row measures; figures from different trackers are never averaged. |
2022–2026 | 133 | 8 | KSE Institute Russian Oil Tracker; CREA; Kpler as reported | CSV |
| Top buyers of Russian crude KSE and CREA rankings by month, volume and value. |
270 | 7 | KSE Institute Russian Oil Tracker; CREA; Kpler as reported | CSV | |
| Urals prices and discounts KSE and CREA monthly, with delivered-India observations. |
2025–2026 | 22 | 7 | KSE Institute; CREA; Argus and Platts as reported | CSV |
| US imports from India by HS chapter and month All 97 chapters, Jan 2024 to Jul 2026. |
2024–2026 | 2,915 | 5 | UN Comtrade (US-reported imports), checked against the US Census Bureau | CSV |
| Rivals' US sales by sector US imports of the same sectors from India, Vietnam, Bangladesh, China and Mexico, January 2025 to July 2026. |
2025–2026 | 1,615 | 6 | UN Comtrade (US-reported imports), checked against the US Census Bureau | CSV |
| Sector totals, 2025 and Jan–Jul 2026 Per sector and country, with India's rank among source countries. |
180 | 10 | UN Comtrade (US-reported imports), checked against the US Census Bureau | CSV | |
| India's exports to the US by HS chapter 98 chapters, FY2024-25, FY2025-26 and Apr–Jul of each year. |
98 | 7 | Commerce Ministry TradeStat (DGCI&S) | CSV | |
| Russia's crude exports by month Russia's stated seaborne crude export volumes per KSE edition. |
2025–2026 | 13 | 7 | KSE Institute | CSV |
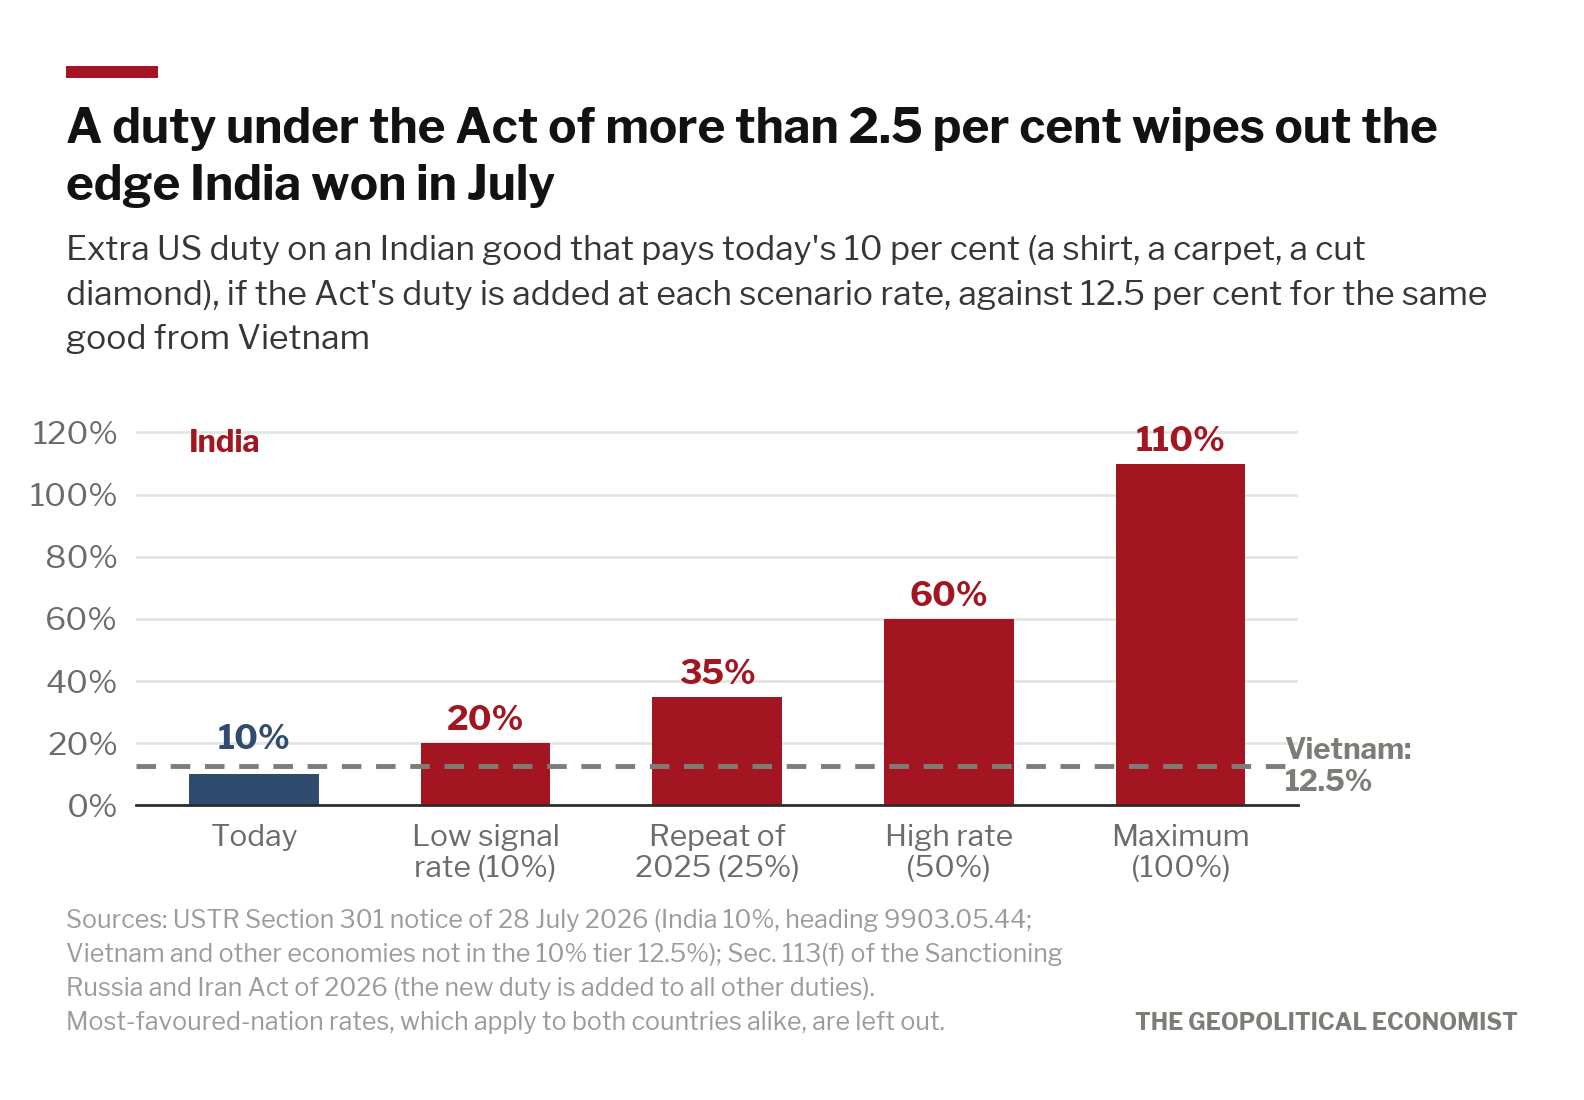
Every series behind the Russian-oil tariff tracker and brief: a dated log of official statements, actions and deadlines with sources; US imports from India by month, by HS chapter and by sector, with the same series for Vietnam, Bangladesh, China and Mexico; the change in each sector's US sales under the 25 per cent duty of 2025-26; India's own export figures and the share of each sector's exports that go to the US; India's Russian crude imports by month in barrels a day and as a share of all crude, by tracker; top buyers of Russian crude by month; Urals prices; and the sector exposure table. Duty-paid figures by sector will be added once the US Census Bureau's trade data can be fetched.
Enrolled text of H.R. 5334; Federal Register; White House; USTR; CBP; PIB; UN Comtrade (US-reported imports), checked against the US Census Bureau; India's Commerce Ministry TradeStat; KSE Institute; CREA; Kpler as reported.
UseFree to use with attribution to The Geopolitical Economist and to the original sources named in each file.
How to citeThe Geopolitical Economist (2026). India and the Russian-oil tariff dataset. Updated 4 October 2026. https://geopoliticaleconomist.com/research/data/india-russian-oil-tariff
Published with this data
-
Research report · South Asia
Will the US Switch On Its Waived 100% Russian-Oil Tariff, and Which Indian Exports Would Pay?
The full report. On 16 October Washington set a 100 per cent duty on the largest buyers of Russian oil and waived it in the same order. What the law and the order say, where India's Russian oil buying stands, how the waiver could end, and which Indian exports would pay if it does.
-
Research brief · South Asia
Will the US Put a Tariff on Indian Goods Over Russian Oil, and Who Would Pay?
A new US law says the President must add a duty of up to 100 per cent to everything India sells to the United States because India buys Russian oil, unless he waives it. What the law says, how likely a duty is by 18 October, and which Indian exports would pay.
Charts
Drawn from this dataset. PNG for screens, SVG for print. Reuse with attribution.