
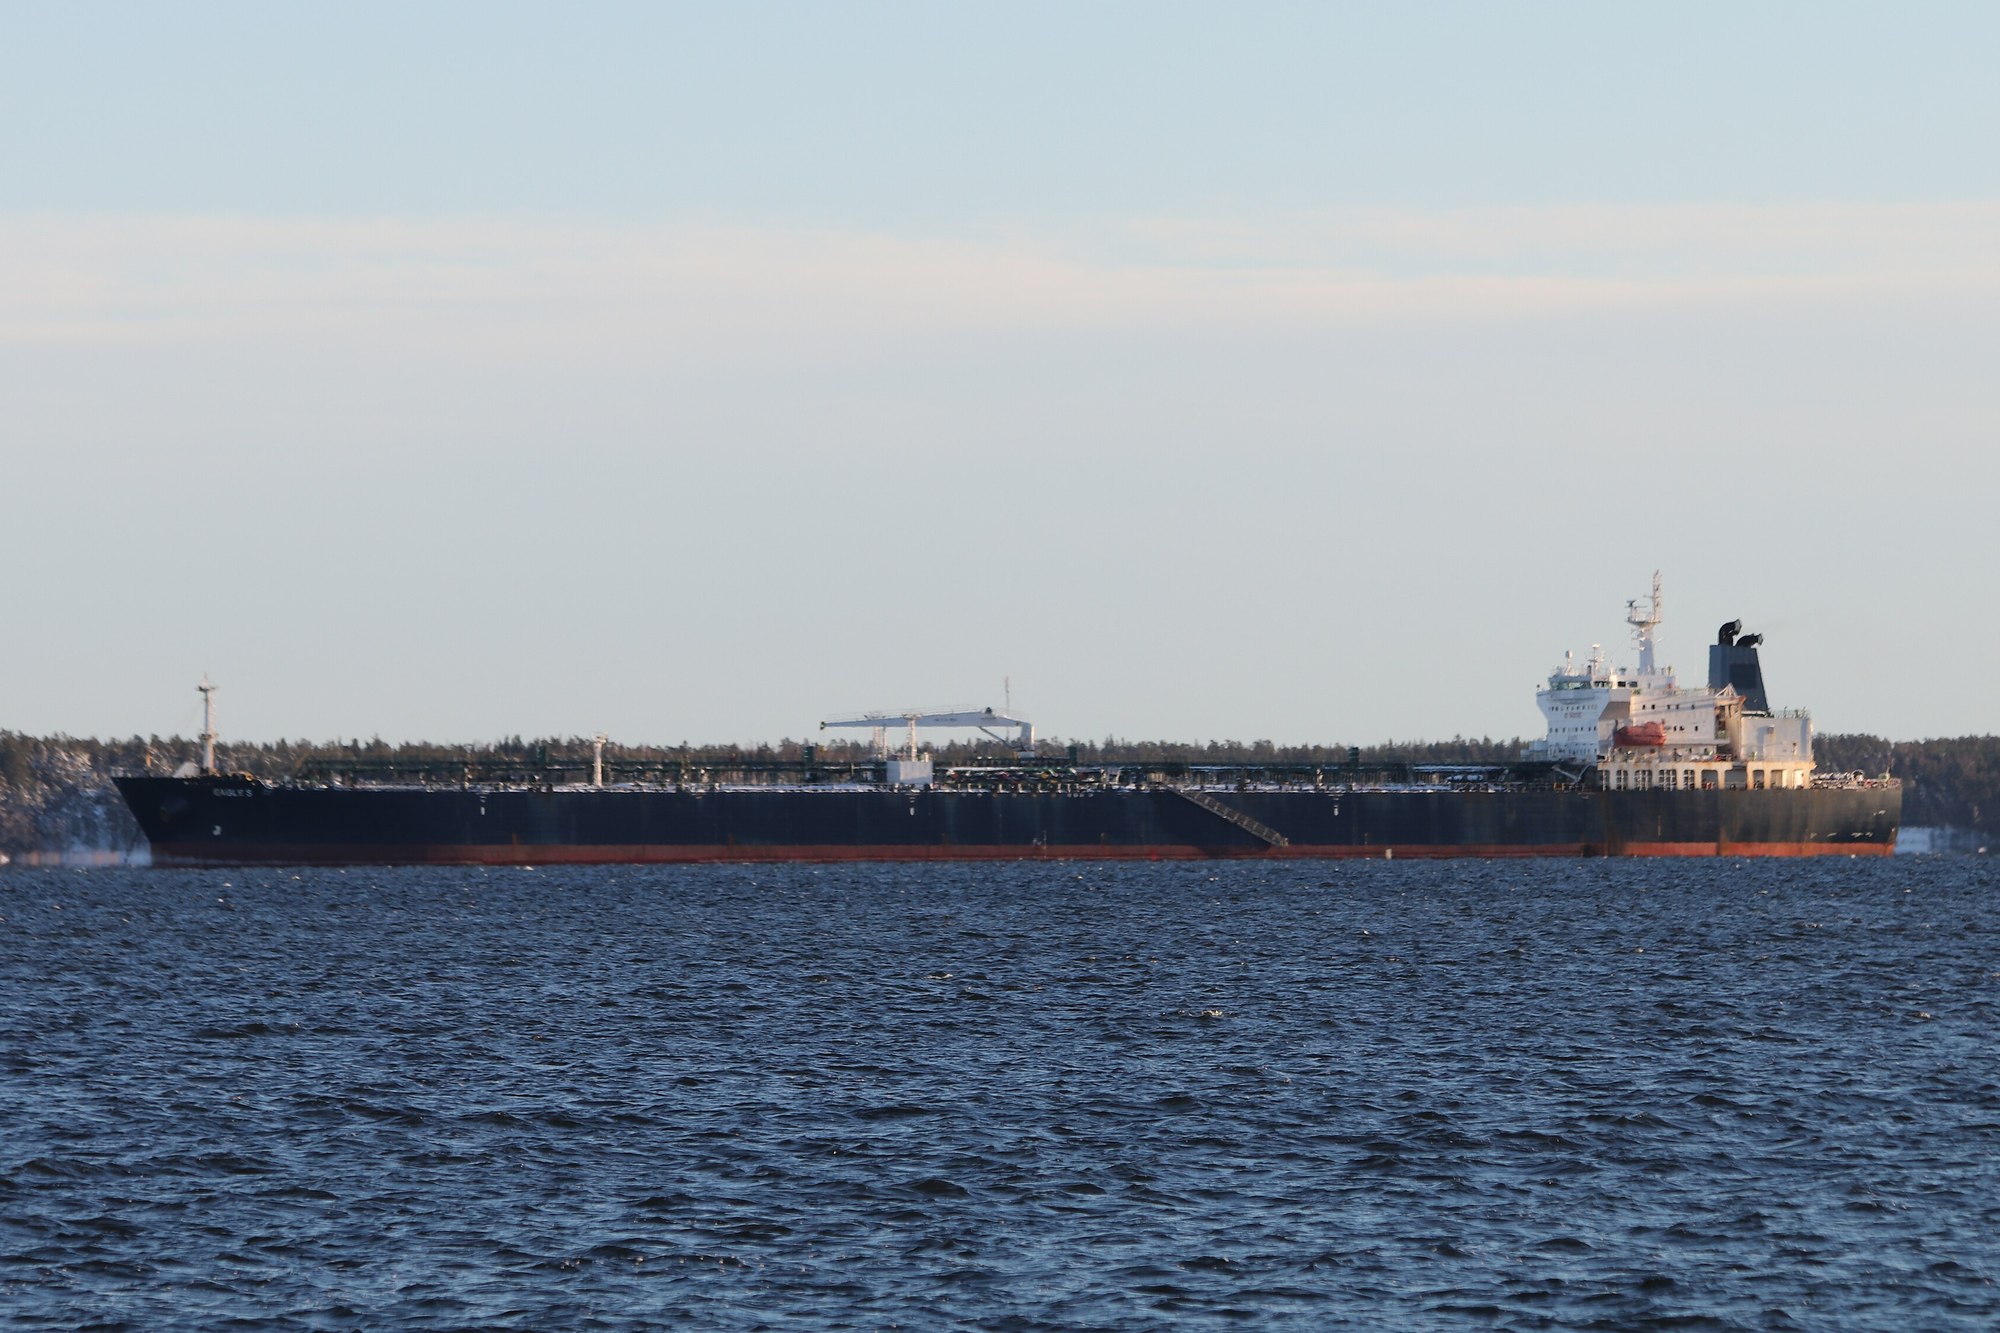
Nearly four years after the Group of Seven, the European Union and Australia imposed a price cap on Russian seaborne crude, that oil is still reaching global markets largely as before. This is not, by itself, evidence that the policy failed. The U.S. Treasury Department stated explicitly when the mechanism launched in December 2022 that its purpose was to limit the revenue the Kremlin earned per barrel while deliberately preserving the global flow of Russian oil, avoiding a supply shock that would have raised prices for every importing country. "Didn't stop Russian oil" is therefore the rhetorical starting point of this argument, not a claim that stopping the flow was ever the policy's goal. The real question is what happened to the second half of that Treasury objective, the revenue side, once the price cap's enforcement mechanism depended on withdrawing Western insurance and shipping services rather than physically blocking tankers. According to tanker tracking analyses by S&P Global and the Kyiv School of Economics, a large parallel shipping and insurance system, widely called the shadow fleet, grew specifically to replace those withdrawn services. That system did not remove Russian oil from the market. It introduced a toll: a discount per barrel and a set of margins captured across an intermediary chain, paid in exchange for evading Western enforcement. The more precise version of the thesis is this: sanctioners sought to constrain Russian revenue without removing Russian oil from global supply, but the enforcement mechanism generated a parallel logistics system whose cost, and whose distribution of who bears that cost, evolved considerably over time.
What the Price Cap Was Designed to Do
The mechanism adopted in December 2022 was deliberately indirect. Rather than banning Russian oil outright (the EU had already banned direct imports of Russian seaborne crude that same month), the coalition targeted the services that make long haul oil shipping possible: insurance, reinsurance, flagging and shipping finance, the large majority of which is concentrated in G7 and EU markets, particularly through the International Group of Protection & Indemnity (P&I) Clubs based in London, which cover approximately 90 percent of the world's ocean-going tonnage. Under the policy, Western firms could legally provide these services to tankers carrying Russian crude only if the oil was sold at or below the cap. This design already contains the seed of the toll booth outcome. It does not physically stop a tanker from loading Russian crude. It withdraws Western insurance and shipping services above the price threshold, leaving exactly one workaround available to a seller willing to accept it: replace the withdrawn services with substitutes that do not depend on Western compliance. Whether that substitute would be cheap or expensive to build, and who would end up paying for it, was always the more informative test of the policy than whether Russian oil would keep moving at all.
The Numbers Behind the Toll
For several months, the mechanism worked close to its intended design. Before the invasion, Urals traded only a few dollars below Brent. Argus and S&P Global Platts assessments show the discount reaching the low $20s a barrel in autumn 2022, widening past $30 in December and peaking near $40 in January 2023, the period when Russian exporters had the least access to substitute insurance and shipping. The revenue picture is harder to read. Russia's oil and gas budget revenue fell 47 percent in the first half of 2023, but the Finance Ministry tied the fall to lower oil and gas prices and reduced gas exports, and the comparison was against a first half of 2022 inflated by the price spike, so it cannot be credited to the cap alone. Volumes tell a clearer story: Rystad Energy put seaborne crude exports at 3.2 million barrels a day in mid-January 2023, and the European Central Bank found them practically unchanged after the sanctions took effect.
That discount did not hold. From late 2023 through 2024, Argus assessments at Russia's Baltic ports show the Urals to Brent gap compressed to roughly $12 to $18 a barrel, and Reuters reported delivered discounts in India of only $1 to $3 by the summer of 2025. The shadow fleet's growth over the same period is well documented, though the exact figures require a methodological caveat. Industry estimates put the fleet at roughly 600 vessels in 2023, and S&P Global counted 978 tankers by September 2025. That count, however, measures the combined fleet serving Russian, Iranian and Venezuelan sanctioned trade, not Russian cargo alone, since much of the ownership, insurance and routing infrastructure is shared across all three. Estimates specific to Russia are smaller: S&P counted 561 ships under Russian control in September 2025. S&P Global data show the share of Russian seaborne crude moved on tankers outside G7 and Western insurance cover rising from 48 percent in November 2022 to 60 percent in September 2023, and the Kyiv School of Economics counted 83 percent in April 2024. The share is not fixed: it fell to about 63 percent by July 2025 as G7 linked tankers returned when Urals traded near the cap, and any single figure varies by source, by month and by whether the count includes crude only or crude plus refined products.
The discount then moved again, and the reasons show how many forces sit behind it. After the United States tightened sanctions on Russia's oil trade in late 2025, Urals discounts widened: Argus data showed the gap at Russia's Baltic ports reaching about $28 a barrel in mid-February 2026, then about $31 in early March, the widest since April 2023, while Indian refiners cut purchases after Washington tied a tariff reduction on Indian goods to a halt in Russian oil buying. Then the war with Iran and the near halt of tanker traffic through the Strait of Hormuz, which pushed oil prices sharply higher from March 2026, reversed the picture. Urals cargoes delivered to India and China traded at premiums of $7 to $8 a barrel above Brent in April and May, Russian oil export revenue nearly doubled between February and March according to the IEA, from $9.8 billion to $19 billion, and Washington issued a temporary waiver for Russian oil already at sea. By early July, with Gulf exports recovering, Urals for delivery to India was again trading at discounts of $10 a barrel or more, according to Reuters, close to levels seen before the war.
The connection between fleet growth and the narrowing discount is best described as mechanically consistent rather than strictly direct. Reuters reported that a one-way Aframax voyage from Russia's Baltic ports to India cost less than $5 million by January 2025, well below earlier peaks, reflecting the risk premium shipowners demanded to operate outside G7 affiliated insurance. As more vessels, insurers and trading intermediaries normalized the logistics, that premium fell, which plausibly explains part of the narrowing discount. But the Urals discount is also influenced by global oil price levels, OPEC+ output decisions, Indian and Chinese refining capacity and market conditions, the distance and route to buyer markets, Russian production levels, individual vessel sanctions, and broader geopolitical risk premia. The fleet's growth is best treated as one substantial contributor among several, not the sole or fully isolable cause of the discount's trajectory. That qualification does not weaken the toll booth framing. It sharpens it: the toll is not a single clean price set by one variable, but an aggregate cost shaped by several forces that sanctioning coalitions can only partly control.
The Precedent: Iran and Venezuela Wrote the Playbook First
None of this shipping infrastructure was invented for Russia. Iran, cut off from most Western insurance and shipping services since intensified U.S. sanctions returned in 2018, developed a dark fleet using older tankers with obscured ownership, frequent flag changes, and transponder signals that go dark during ship to ship transfers, the same tactics OFAC catalogued in its 2020 maritime advisory on Iran, North Korea and Syria and the Price Cap Coalition catalogued again in its October 2023 advisory. Venezuela's oil exports, under U.S. sanctions since 2019, followed a comparable pattern, increasingly reliant on Chinese buyers and non-Western tankers. When Russian oil needed to escape the price cap in 2022, this infrastructure, built and refined over the prior decade, was already available and already profitable for the operators running it. Russia scaled an existing model rather than inventing one, and did so at a larger volume than either precedent: Iranian seaborne exports peaked at roughly 2.5 million barrels a day of crude before falling sharply after 2018, while Russia's seaborne crude exports ran at roughly 3 to 3.7 million barrels a day through most of the cap period and reached about 4.2 million barrels a day by mid-2026, on Bloomberg tanker tracking. A state exporting more oil, with a central bank experienced in managing sanctions related capital flows, was never going to be the easier target, and the data since 2022 confirm that the harder case produced, if anything, a faster migration to the workaround.
Who Pays the Toll, and Who Collects It
The toll booth framing requires a more precise answer than "Russia pays" or "intermediaries profit." The toll is better understood as a rent distributed unevenly across an evasion chain rather than a fee collected by any single actor. The Russian exporter bears part of the cost through the per barrel discount relative to Brent. Shipowners operating older tankers outside G7 insurance capture part of the toll as a risk premium built into freight rates, a premium that was highest when the fleet was small and fell as it matured. Non-Western insurers and the trading firms arranging cargo capture a further margin for absorbing compliance risk. Buyers, principally Indian and Chinese refiners, capture the discount itself as a direct input cost advantage. S&P Global put Russia's share of India's crude imports at more than 35 percent in 2023, and Reuters at about 40 percent in the first half of fiscal 2023/24, up from about 0.2 percent before the war, a shift substantial enough that it likely accounts for a meaningful part of the volume the shadow fleet had to accommodate, though this remains an inference rather than a figure drawn from an explicit, published calculation. Indian refiners have in turn exported refined products such as diesel and jet fuel to Western markets that decline Russian crude directly but historically did not restrict refined products of mixed origin in the same way, a gap the EU voted to close in July 2025, with a ban that took effect in January 2026. Each link in this chain captures a different piece of the toll, which means the coalition seeking to raise the toll's overall size has to raise it at multiple points simultaneously rather than at one.
That is, in practice, the direction policy has taken, through two distinct instruments rather than one. The EU's 18th sanctions package, adopted in July 2025, lowered the price cap to $47.60 a barrel, an instrument aimed at the per-barrel revenue Russia can legally realize through Western-linked buyers. The same package added 105 vessels to the EU's restricted list, bringing the total to 444 listed tankers, an instrument aimed instead at the operating capacity and cost of the alternative logistics network itself. The same package also introduced an automatic mechanism that resets the cap at 15 percent below the average Urals price, and its first application lowered the threshold again, to $44.10 a barrel, from February 2026. Read together, these steps show sanctioning authorities treating both the price threshold and the fleet's operating capacity as levers worth pulling simultaneously, evidence that policymakers came to regard the alternative infrastructure itself as a central enforcement problem, rather than a side effect the original 2022 design could safely ignore.
The mechanism then turned against its own purpose. When the Iran war lifted Urals prices, the scheduled July 2026 review would have raised the cap to roughly $58 a barrel. The EU's 21st package, adopted on July 23, froze it at $44.10 until July 2027. That episode shows the limit of a cap indexed to market prices: a rule built to follow the market is only as tough as the market allows, and here political decision had to suspend it. The same package also created a power to ban transactions with third country refineries that process Russian crude.
What Would Prove This Wrong
This analysis would be significantly weakened, or reversed, under specific and measurable conditions. First, if IEA reported Russian seaborne export volumes fall by a sustained margin, meaningfully below the roughly 3 to 3.5 million barrels a day of 2023 and the roughly 4.2 million that tanker tracking showed by mid-2026, for two or more consecutive quarters, in a way that does not track OPEC+ quota decisions made for unrelated reasons, that would indicate enforcement has moved from taxing the trade to genuinely constraining supply. Second, if the Urals Brent discount widens back toward the $25 to $30 range and holds there for several months following the 2025 and 2026 cap reductions, rather than continuing the compression trend visible from 2022 through 2024, that would show enforcement outpacing the fleet's ability to adapt. Third, if tracked shadow fleet tonnage specific to Russian cargo declines, rather than continuing to grow, as a direct result of vessel level sanctions designations, that would indicate rising operating costs are shrinking capacity rather than merely raising price. Fourth, if India's or China's share of discounted Russian crude falls materially in response to secondary sanctions risk rather than continuing to expand, that would show the toll has become high enough to change demand side behavior, not only supply side behavior. As of the latest reporting, the record is mixed. Volumes did not fall: crude shipments reached records in mid-2026, partly because Ukrainian strikes on Russian refineries pushed more crude into export. The discount did widen toward the $25 to $30 range at Baltic ports from late 2025 into March 2026, and Indian purchases fell, so the second and fourth conditions were partly met, but the Iran war reversed both within weeks, which suggests the toll responds at least as much to market shocks as to enforcement. That is why a toll booth description still fits the evidence better than either a sanctions succeeded or a sanctions failed framing.
Conclusion
The price cap on Russian oil was never designed to remove that oil from global markets, only to reduce what Russia earned per barrel while the flow continued, and judged against that actual objective rather than a stricter one, the results are mixed rather than binary. A parallel shipping and insurance system, built on a model Iran and Venezuela had already tested, came to carry most of Russia's seaborne crude exports, more than four fifths at its 2024 peak by one tracker's count, while the discount Russia paid for that workaround narrowed from a peak near $40 a barrel toward $12 to $18 as the system matured, a toll distributed unevenly across shipowners, insurers, traders and refiners rather than collected by any single actor. Export volume and net revenue per barrel are different variables, and the data show the first held steady while the second was squeezed, then partly recovered, then swung again with new sanctions and the Iran war. The 2025 and 2026 rounds of cap reductions target the per-barrel revenue directly, while the accompanying vessel designations target the logistics capacity that made the discount's recovery possible in the first place, evidence that policymakers now treat the infrastructure collecting the toll, not only the trade itself, as the lever still worth pulling.
Comments
No comments yet. Be the first.
Comments are closed on this article.