
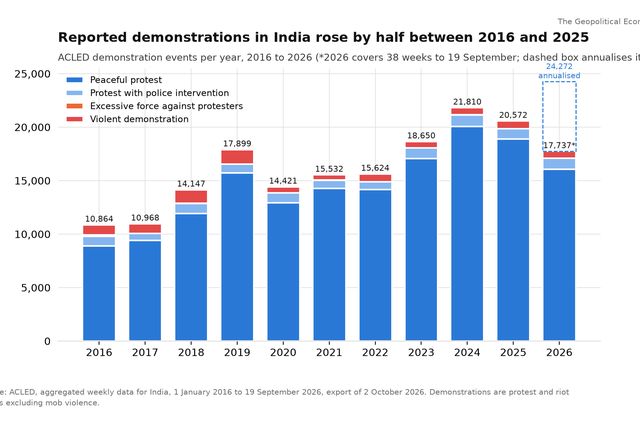
Part 1 of this series established that Indians are protesting more: about half as many demonstrations again as a decade ago, a record in 2024, a higher one coming in 2026, and less violence, not more. It did not say why.
This part asks the first and most ordinary explanation: are people protesting because they are hurting? It puts the grievance data, on prices, jobs, examinations, farms and the tariff shock, against the protest data, and asks where they meet.
The answer is more specific than "the economy". The thing Indians march about most, and increasingly, is the state's failure to run a fair examination and fill a job. The 2026 price shock, the sharpest in years, barely moved the count. The strike has all but disappeared, while the street protest has grown. And the export towns that lost the most from American tariffs produced layoffs, not protests.
That pattern matters for anyone trying to read India's politics, and it matters in a practical way for anyone running a business there. Here is what the data shows.
What the grievance is
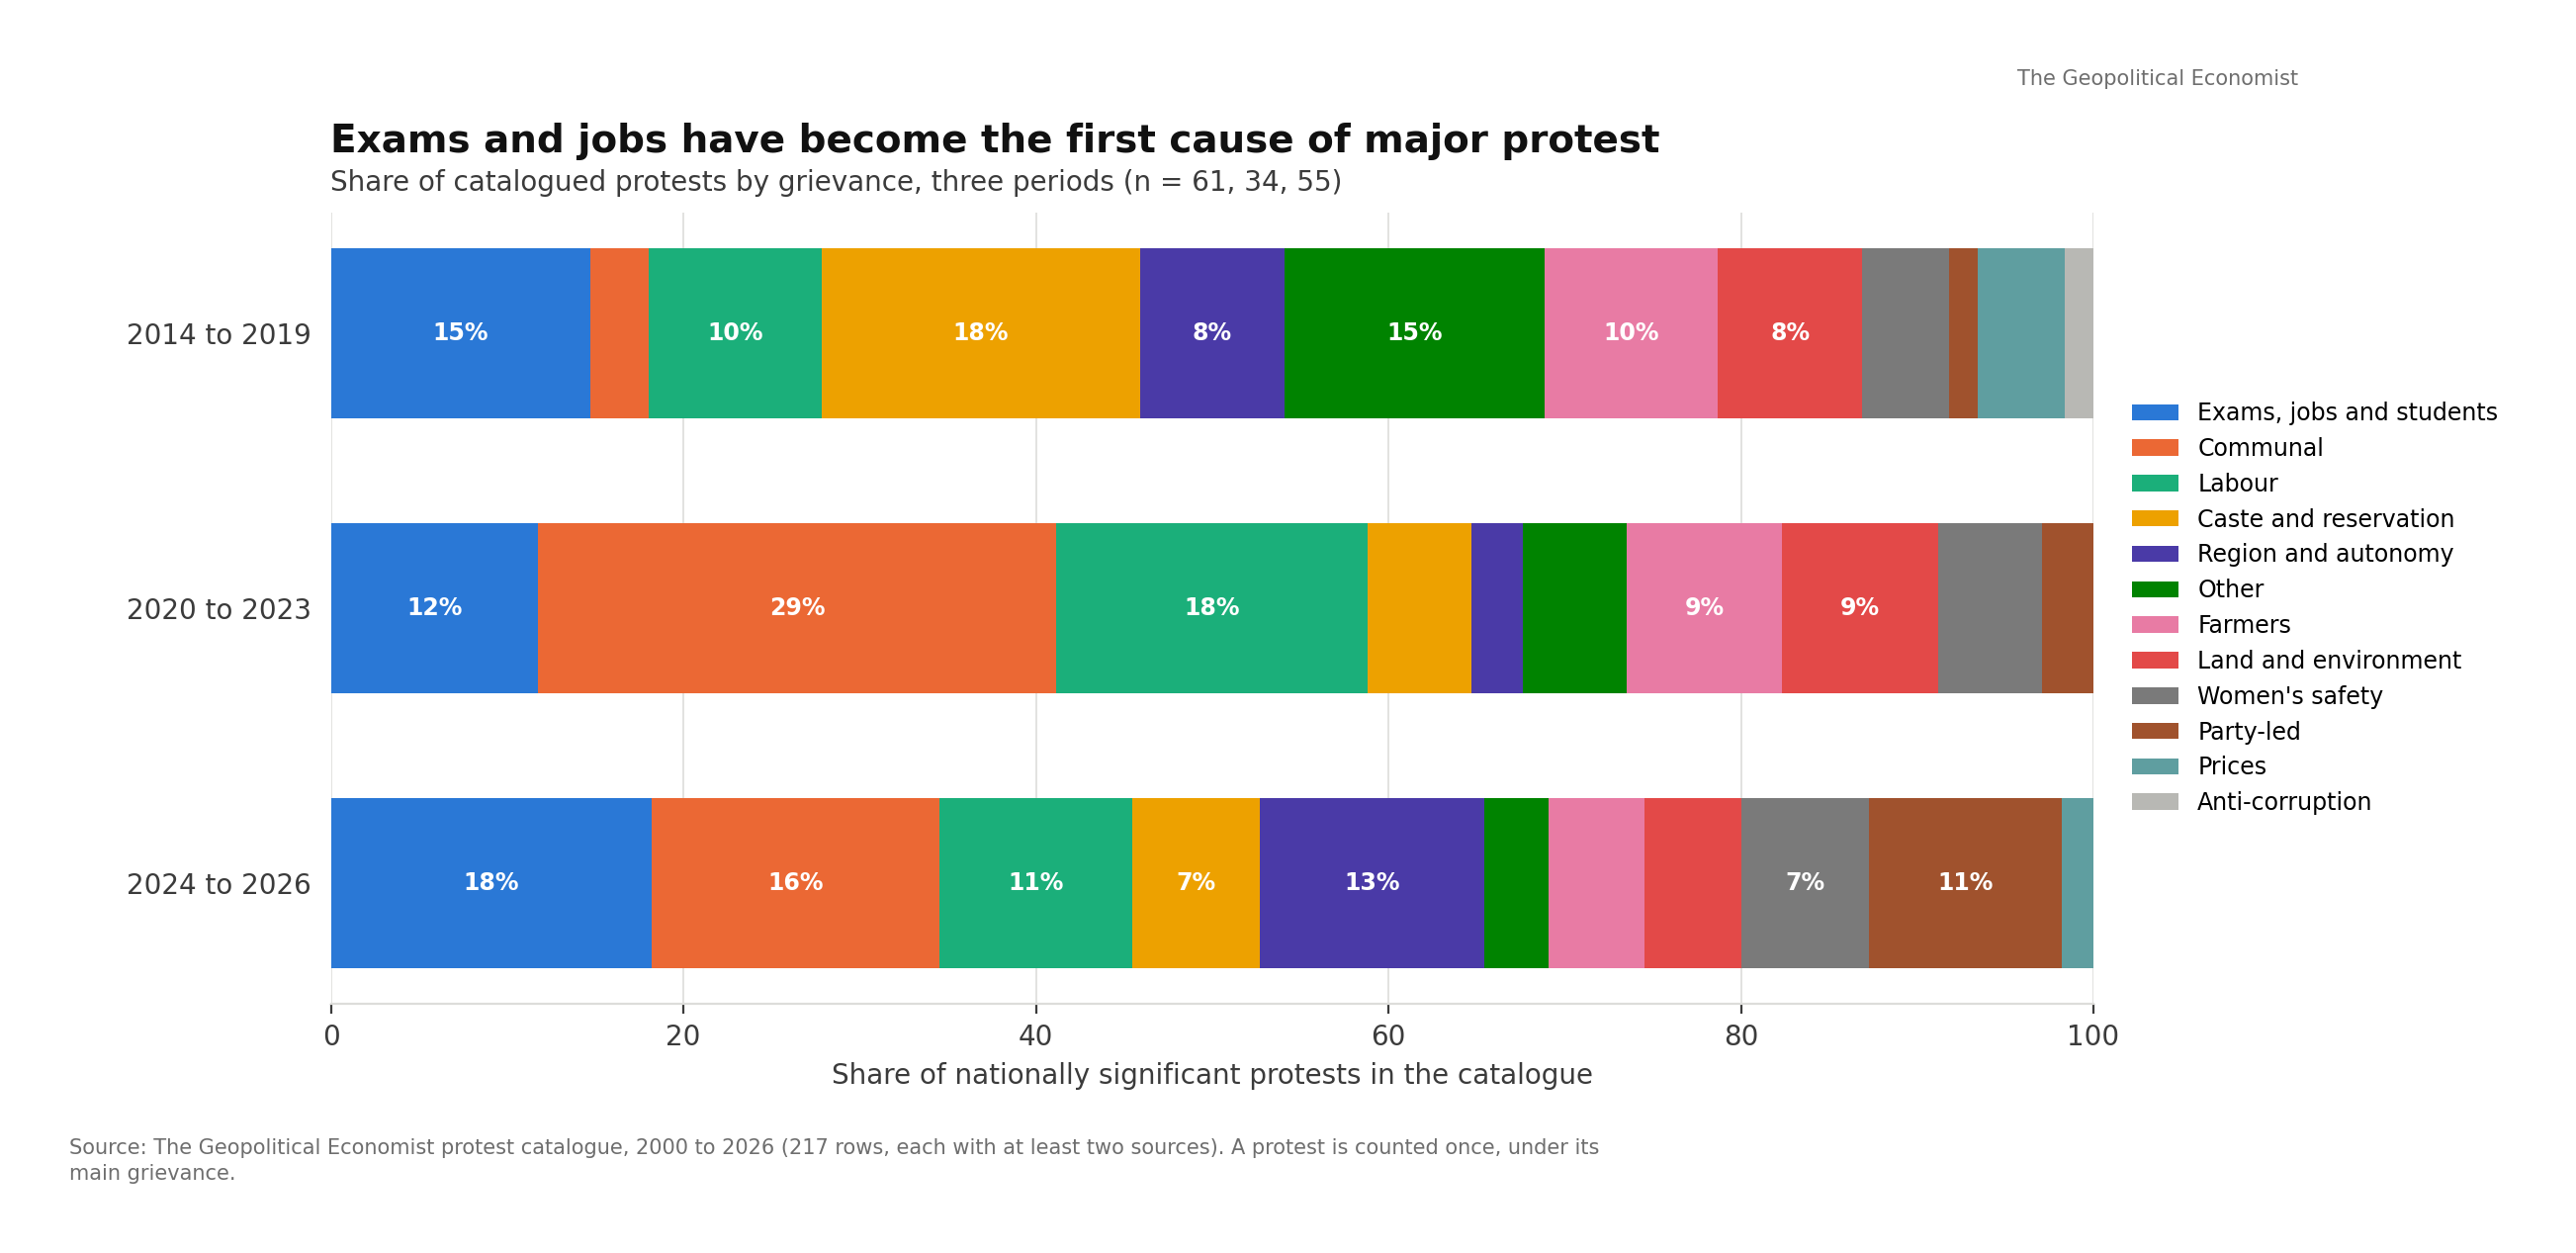
The catalogue built for this series records 217 nationally significant protests since 2000, each coded by its main grievance. Split into three periods, the mix changes in a way the headlines have not caught up with.
From 2014 to 2019, caste and reservation disputes led (18 per cent of the 61 major protests of those years: the Jat, Patidar and Maratha agitations), with examinations and jobs second at 15 per cent. From 2020 to 2023, communal protest dominated, 29 per cent of 34, the years of the citizenship law and its aftermath, with labour second.
Since 2024, examinations, jobs and students are the first cause of major protest in India, 18 per cent of the 55 catalogued, ahead of communal (16 per cent), regional and autonomy demands (13 per cent, Ladakh and Manipur), labour (11 per cent) and party-led protest (11 per cent). Caste has fallen to 7 per cent. Prices, the grievance that fills the opposition's press releases, account for one major protest in the period.
The exam state is the grievance. That is the single finding of this part, and the rest of it tests whether anything else comes close.
The examination machine
India runs the largest competitive examinations on earth, and it keeps breaking them.
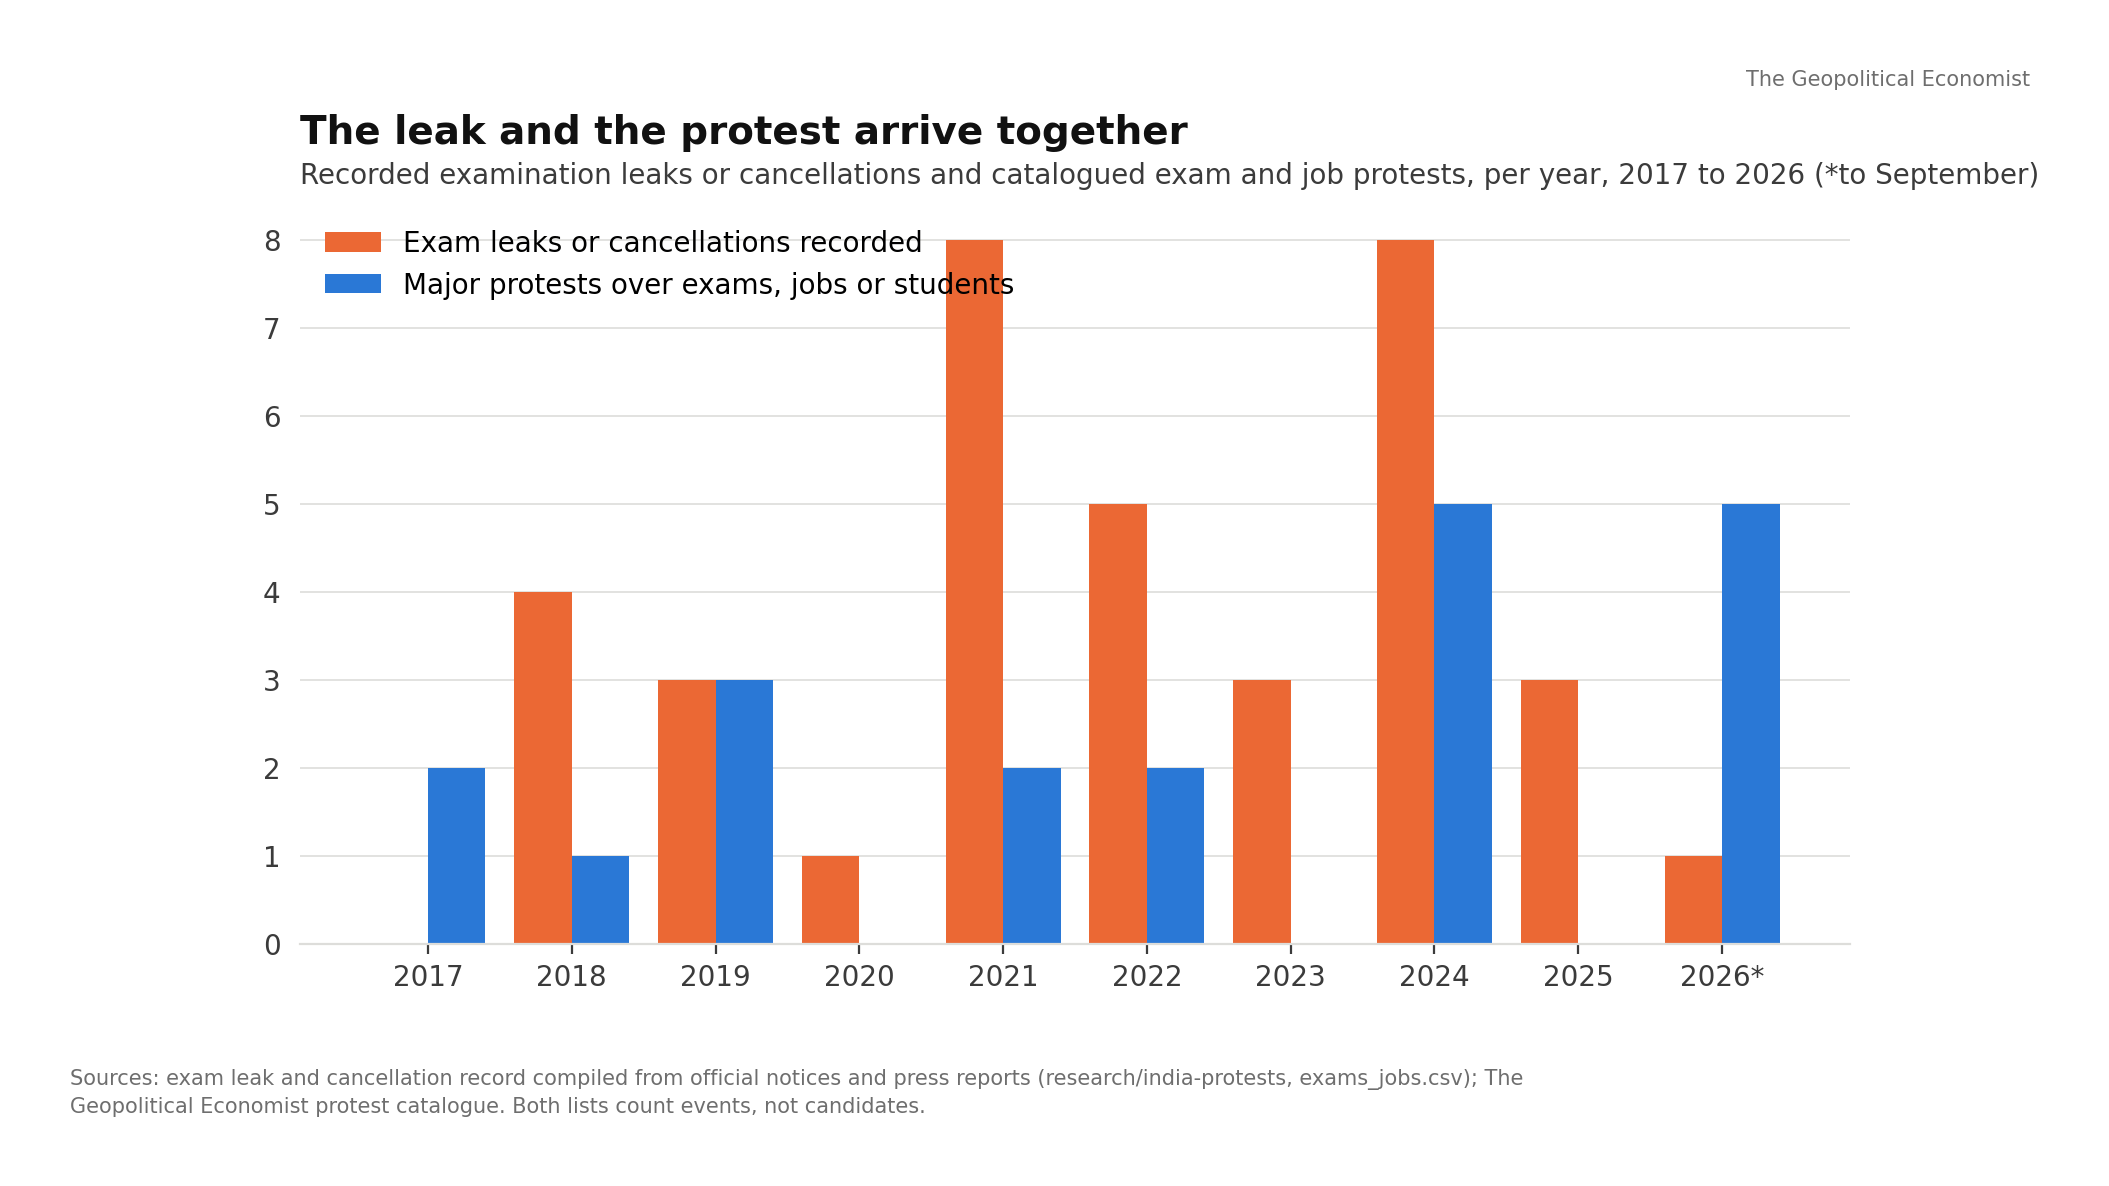
Our record of leaks and cancellations, compiled from official notices and press reports, counts eight in 2021, five in 2022, eight in 2024 and the NEET-UG of May 2026, the medical entrance examination sat by 2.27 million candidates and cancelled on 12 May. The catalogue's exam and job protests follow the same curve: five major protests in 2024, when NEET and the UGC-NET, with 1.1 million registered candidates, were cancelled within a fortnight of each other, and five in the first nine months of 2026, from Jantar Mantar to Ranchi to Patna.
The leak and the protest arrive together because of what sits behind the examination. Union government posts stood at 3.92 million sanctioned and 824,000 vacant on 1 March 2024, a vacancy rate of 21 per cent. Into the few posts that are advertised pour the many: 12.1 million applications for 11,558 railway posts in the 2024 cycle, more than a thousand for each; 4.88 million for 25,487 constable posts in 2026, nearly two hundred for each.
When the odds are two hundred to one and the paper leaks, the loss is not abstract. A year of coaching, a family's savings and a place in a queue are gone. That is why a leak in Patna fills the streets within days, and why the protest is aimed at the examination board and the minister, not at any employer. The Education Minister's resignation on 25 July 2026, after ten weeks of the Cockroach Janta Party's protests, was the first time in decades that a Union minister fell to a student movement.
Measured unemployment, meanwhile, is flat. The monthly labour force survey put unemployment at 5.1 per cent in July 2026, urban unemployment at 6.7 per cent, and youth unemployment at 14.4 per cent in December 2025, 18.1 per cent in the cities. Those figures have barely moved in three years. The grievance is not a sudden loss of work. It is the collapse of trust in the one route to a secure job that millions of families have organised their lives around.
The price shock that did not move the count
If any year should have produced price protests, it was this one.
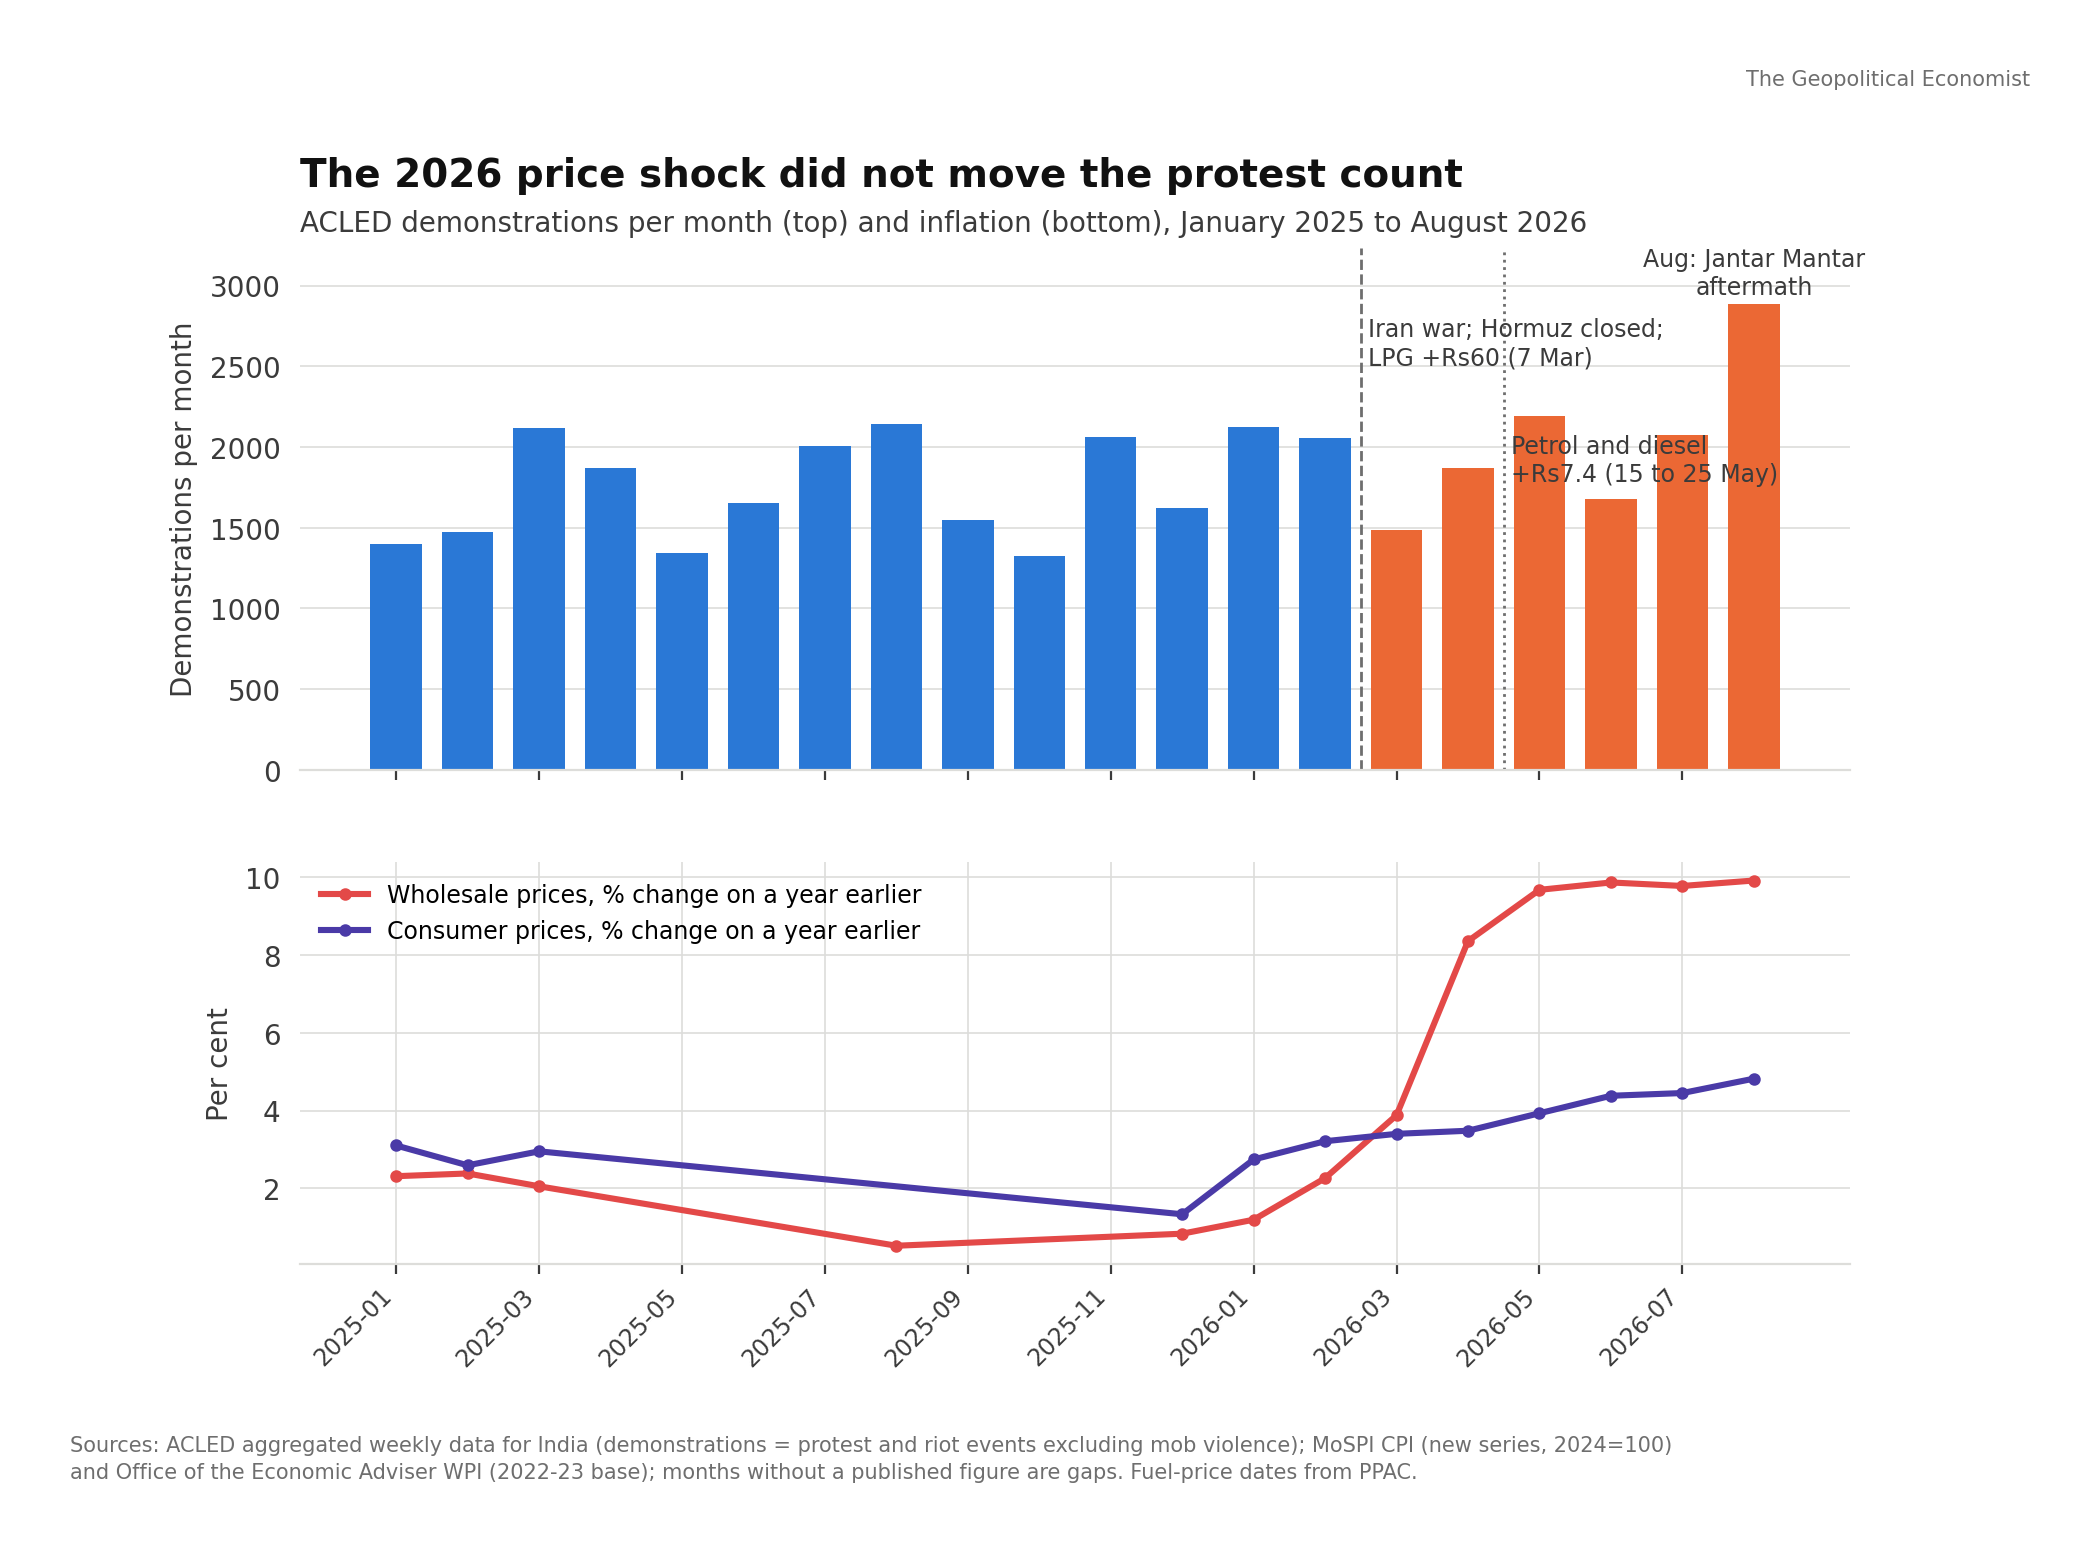
The Iran war began on 2 March 2026 and shut the Strait of Hormuz within days. Domestic LPG rose by Rs 60 a cylinder on 7 March and by a further Rs 29 in June; there were shortages in March and April. Petrol and diesel, frozen for 76 days, rose four times in ten days in May, by about Rs 7.4 a litre, to Rs 102 for petrol in Delhi. Wholesale inflation went from 0.8 per cent in December 2025 to 9.9 per cent in August 2026, with fuel and power up by a fifth or more; consumer inflation from 1.3 to 4.8 per cent, food leading.
The protest count did not respond. March 2026, the month the war began, had 1,489 demonstrations, the fewest since October 2025. April and May were ordinary months. The surge came in July and August, and it was about examinations, not fuel. Over the ten years for which both series exist, the monthly protest count and consumer inflation are uncorrelated: a coefficient of 0.07, which is to say none.
Price protests do happen. The catalogue has them: Congress rallies in Delhi on 13 March, Bengaluru on 3 May and Kohima on 30 May. But they are organised by parties, they last a day, and they are seven of the 217 major protests since 2000. The cost of living is a grievance that opposition parties carry to the street on behalf of a public that, so far, does not carry it there itself. That may change if the shock persists into a second year. It has not changed yet.
The strike has withered, the bandh has not
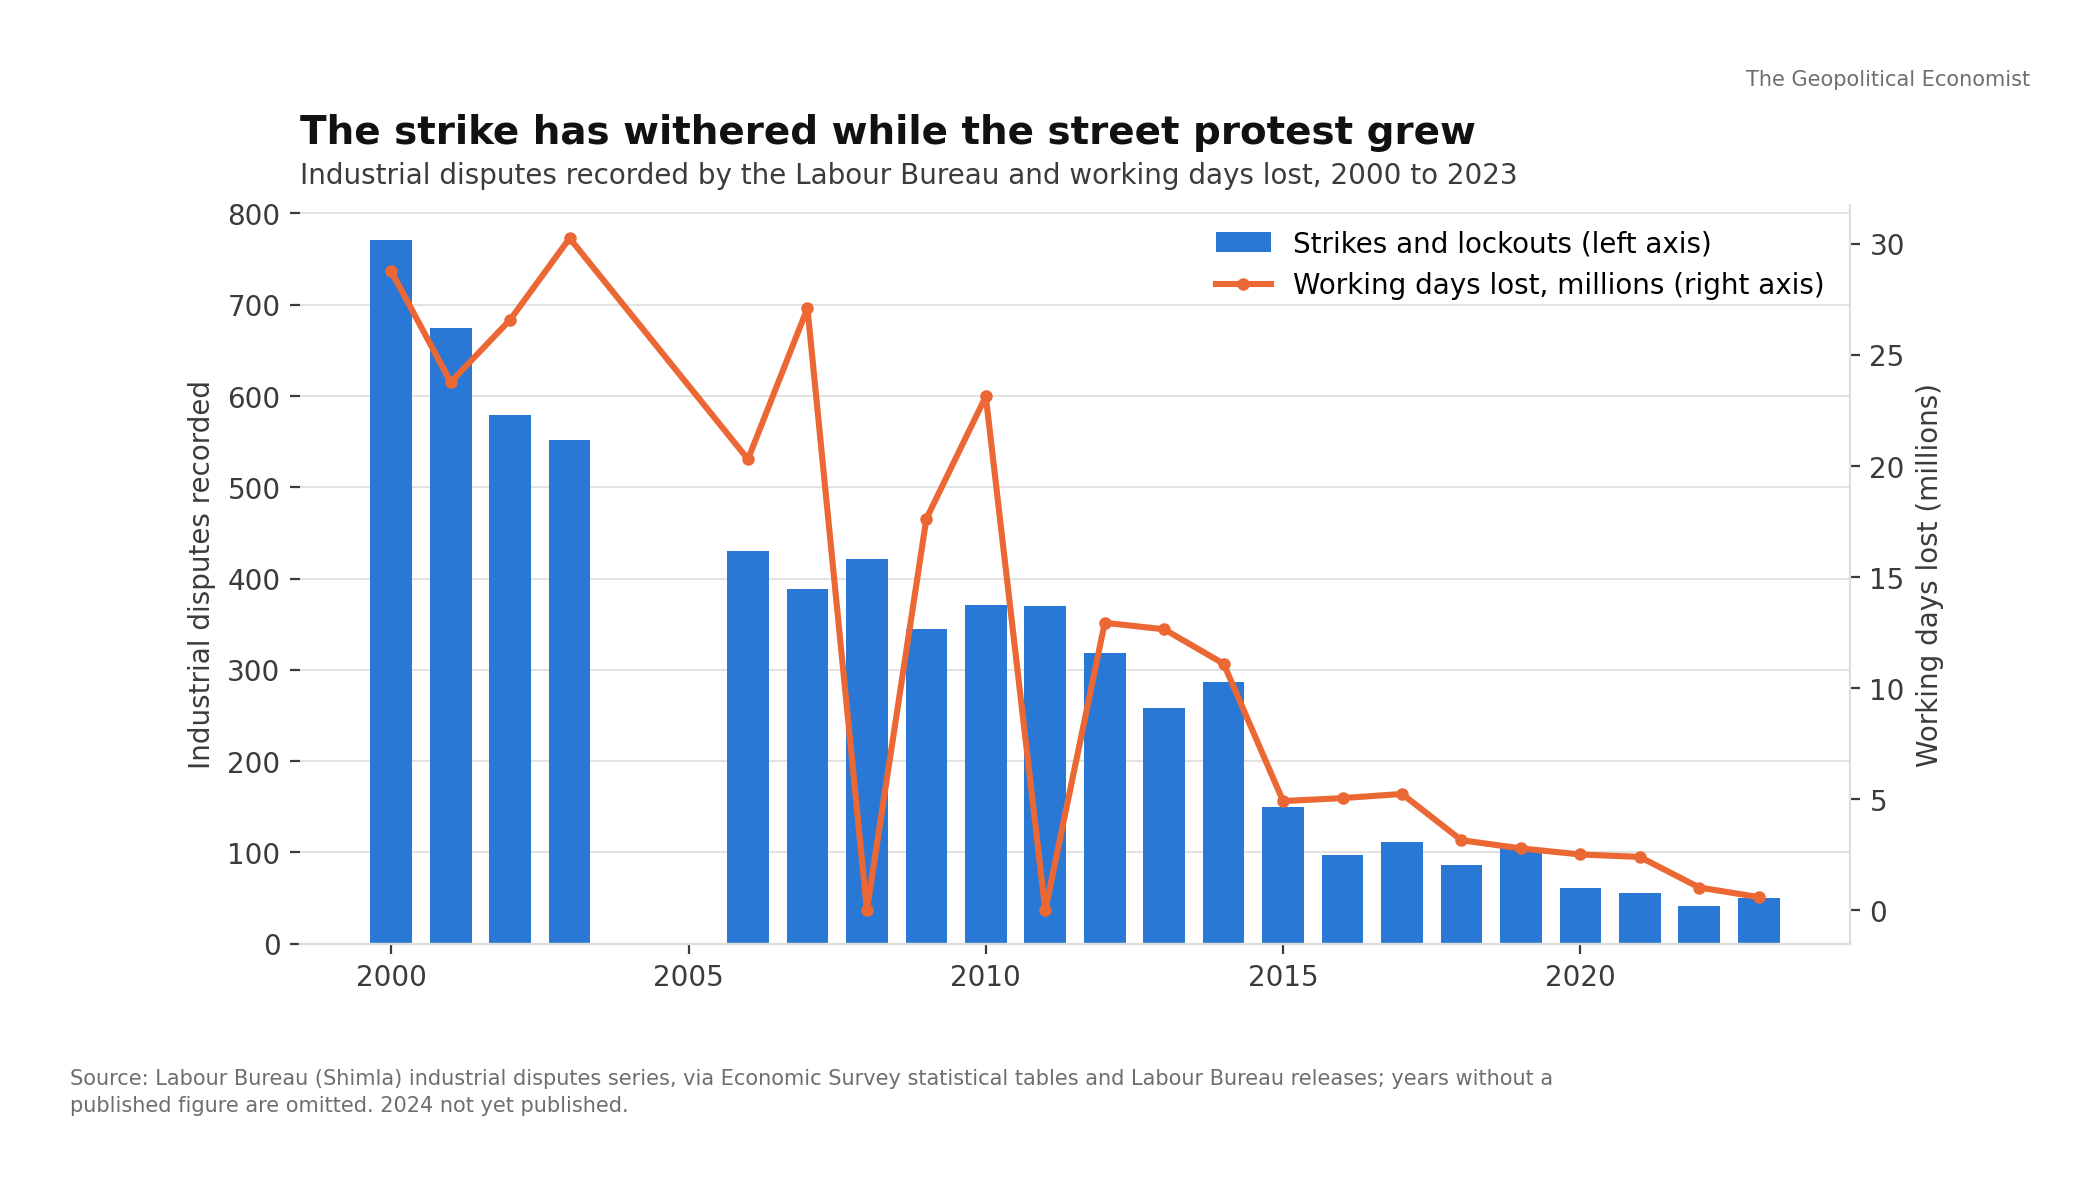
A generation ago, labour unrest in India meant the strike. The Labour Bureau recorded 771 strikes and lockouts in 2000, costing 28.8 million working days. By 2023 the count was 50 disputes and 0.6 million days: a fall of more than nine tenths in both. The organised, factory-level strike has almost ceased to exist.
Labour protest has not. It is 11 per cent of major protests since 2024, and it has changed form. It is now the political general strike, the Bharat Bandh of 12 February 2026 called by the central trade unions against the new labour codes and the law replacing the rural employment guarantee, which shut banks and government offices for a day across several states; it is the wage protest in Noida in April 2026, where thousands of garment workers met tear gas and more than 300 were arrested; and it is the general strike of July 2025, which the unions said 250 million joined and which varied, in the Deccan Herald's phrase, from state to state.
The shift tells you where the leverage went. Workers who cannot strike a factory, because the factory is informal or the union is absent, can still stop a city for a day with a party's help. For an employer the exposure has moved from the shop floor to the calendar.
The shock that produced no protest
The sharpest external blow to Indian employment in 2025 was Washington's tariff, raised to 50 per cent on 27 August 2025, the highest on any major trading partner, then cut to 18 per cent in February 2026 and to 10 per cent in July after the courts struck down its legal basis.
The damage was concentrated where India's labour-intensive exports are: gem and jewellery exports to the United States fell 44 per cent between April and December 2025; the industry estimated that 150,000 diamond workers in Surat lost their jobs; Tiruppur's knitwear cluster, with more than 600,000 workers, put 100,000 to 200,000 jobs at risk. No official job-loss figure has been published.
The catalogue contains exactly one tariff protest: a thousand workers at Orient Craft in Ranchi in April 2026, where the management blamed the American duty. Gujarat, home to Surat, recorded about 210 demonstrations a year in 2024 to 2026, among the lowest of any large state, and no rise. The workers who lost most did not march. They went home to Saurashtra, Odisha and Bihar.
This is the quiet finding of the grievance data, and the most important one for the "why". Economic pain in India's informal economy does not reliably convert into protest, because the people who bear it are migrants without a union, a party or a city to hold. Protest converts when the grievance is against the state, when the aggrieved are already gathered, as students and aspirants are, and when a date, a result or a leak gives them a day to gather on.
When and where
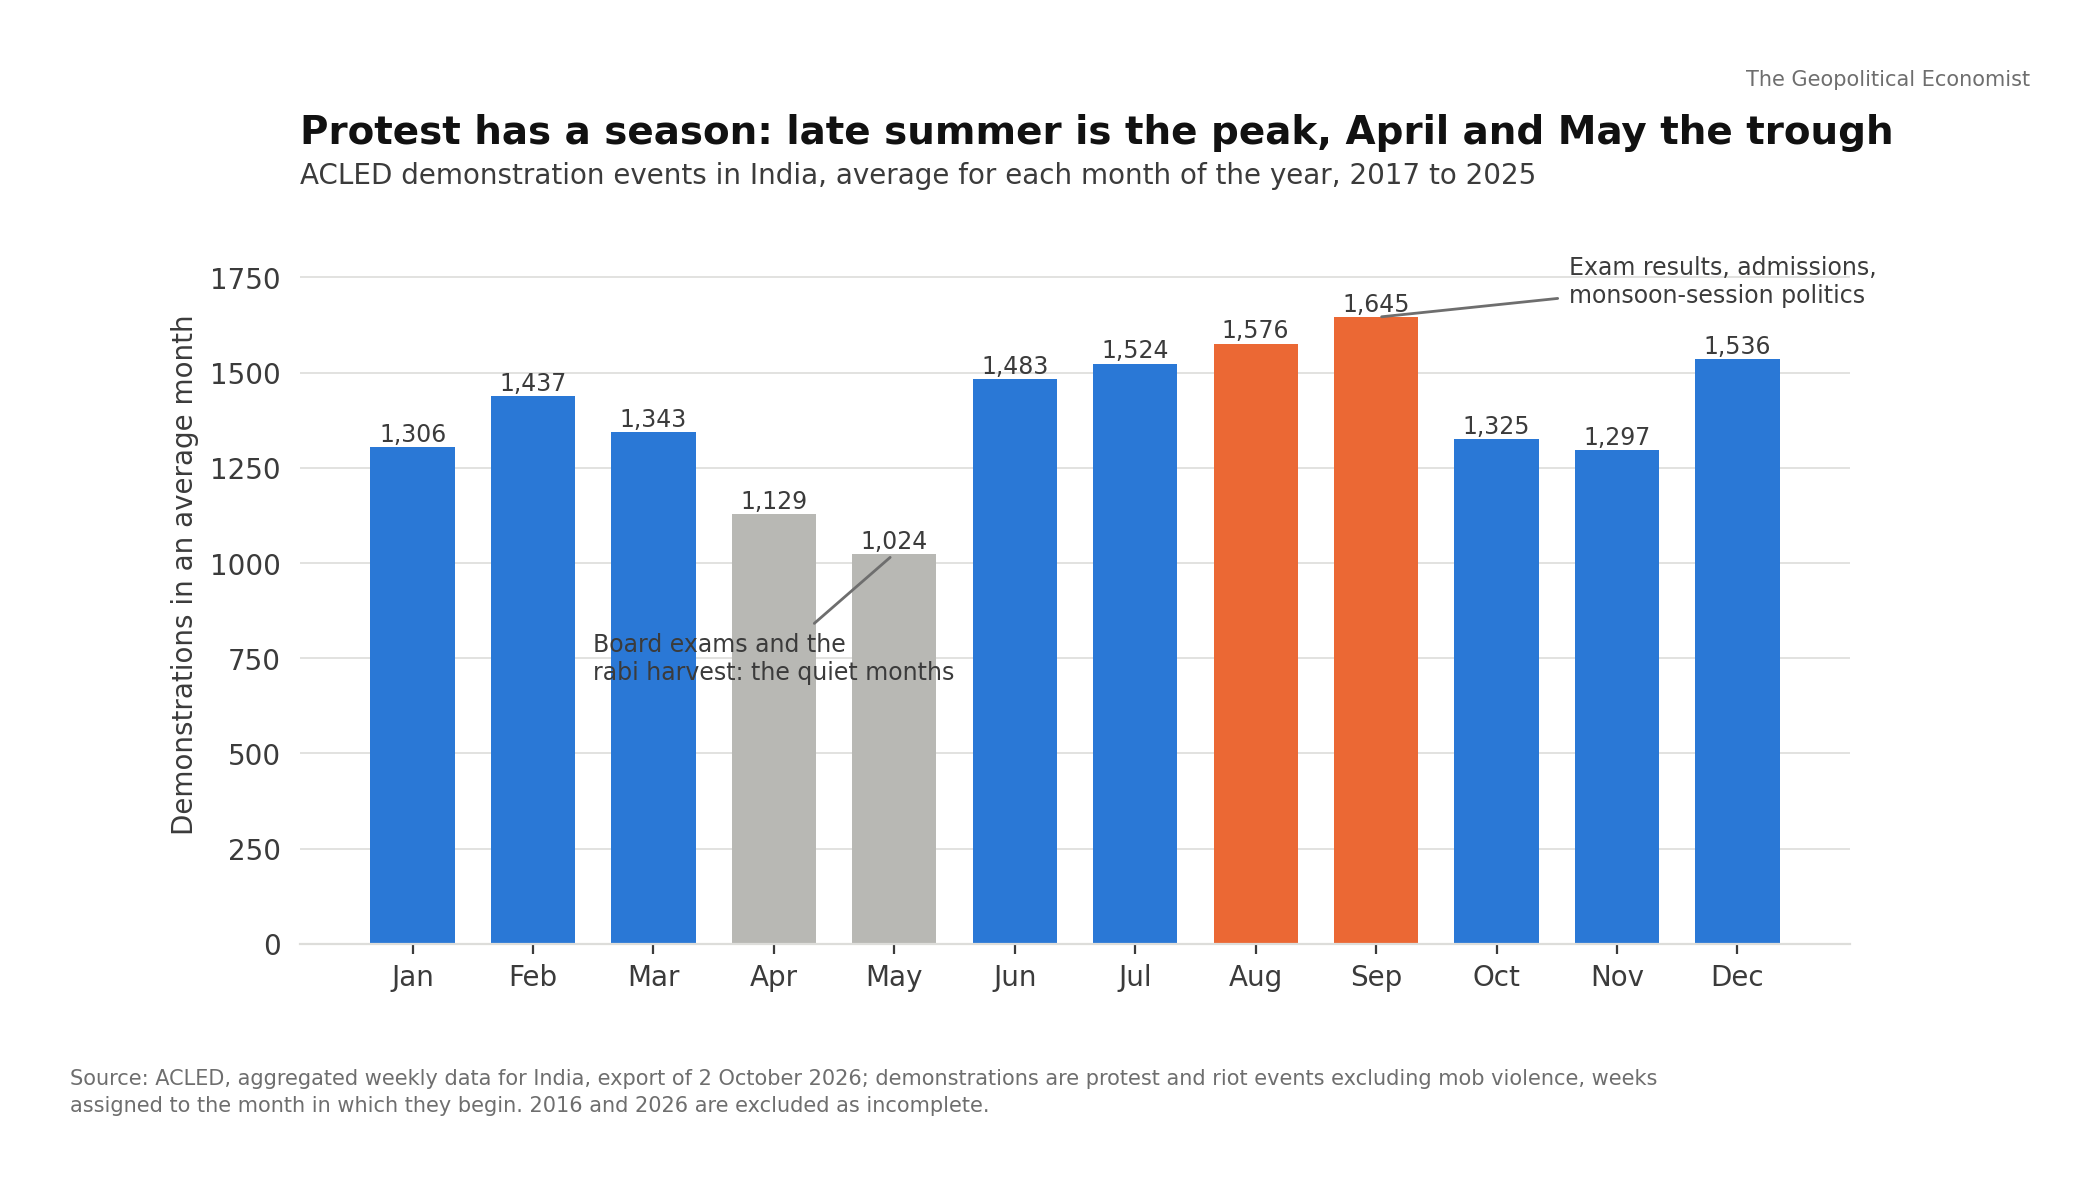
Protest in India keeps a calendar. Averaged over 2017 to 2025, August and September are the busiest months, with about 1,600 demonstrations each, and April and May the quietest, with 1,000 to 1,100. The trough is the season of board examinations and the rabi harvest. The climb begins in June, with entrance results and admissions, and runs through the monsoon session of Parliament. December is the second peak. None of this is about elections: Part 1 found that only 44 of the 217 major protests began within six months of a relevant poll, and there is no state election in India until February 2027.
The map has shifted too. The states where demonstrations rose most between 2017 to 2019 and 2024 to 2026 are Telangana (up 253 per cent), Madhya Pradesh (256), Karnataka (159), Uttar Pradesh (128) and Manipur (110). Tamil Nadu is now the busiest state, at about 1,900 demonstrations a year, and Punjab, at 1,800, has been at that level throughout. Jammu and Kashmir is the only large state where the count fell. These are not the poorest states, and they are not the states with the highest unemployment. They are the states with the largest student populations, the most recruitment examinations, and, in Punjab and Telangana, the most organised farmers.
What this means for companies
Most of this series is about the state. This section is about the reader who has a factory, a supply chain or a payroll in India, and who needs to know what the protest count means in practice.
Protest in India is not, in the main, aimed at business. Since 2024, the grievances behind major protest are examinations, jobs in government, communal and regional disputes, and party politics. Labour protest is a tenth of the total and takes the form of the one-day bandh, not the plant occupation. The exposure for a company is disruption, not targeting.
The disruption is short, local and increasingly peaceful. Deaths in demonstrations fell from 170 in 2016 to 15 in 2025. Government-ordered internet shutdowns, the single most costly form of disruption for a modern business, fell from a peak of 134 in 2018 to 65 in 2025, the lowest since 2017, though India still orders more than any other democracy. The typical event is a road or rail blockade, a bandh, or a march that closes a city centre for a day.
Plan around the calendar, not the headlines. Late June to September and December are the months to expect disruption; April and May are quiet. Examination results and recruitment notices, from NEET to the state service commissions, are the triggers to watch, and a confirmed leak now produces protests in Patna, Prayagraj, Jaipur, Ranchi and Delhi within days. The farm calendar matters in Punjab and Haryana, where the Samyukt Kisan Morcha's week-long protest at Chandigarh in September 2026 was aimed squarely at the India–US trade deal.
The quiet places carry a different risk. Surat and Tiruppur did not protest the tariff shock, and that silence is not safety. It is a workforce that absorbs losses by leaving, which reappears as labour shortage when orders return, and as reputational exposure for buyers whose suppliers shed workers without notice.
Watch the political bandh, not the strike. The labour codes, the rural employment law and the trade deal are the grievances the trade unions and farm unions have chosen for 2026. Each national bandh costs a day of banking, transport and public offices in the states where the unions are strong: Kerala, West Bengal, Punjab, Tamil Nadu, Telangana. They are announced weeks ahead.
The underlying signal for an investor is this: India's protest wave is a demand on the competence of the state, made overwhelmingly by the young and overwhelmingly without violence. It is a stress on governance, not on property. The economy's visible risk is in the examination hall, not the factory gate.
What the grievance data cannot show
Two limits apply.
The first is the coding. Each catalogued protest is assigned one main grievance, and many protests have several: the Cockroach Janta Party movement was about an examination, a judge's words and the police, all at once. The shares above are the best single reading, not a measurement of motive.
The second is the gap this part leaves open on purpose. A grievance explains why people were ready to protest. It does not explain how a movement that began with a leaked paper reached fifteen million followers in a week, or who organised the national day of marches on 20 July, or whether the 480 Pakistan-based accounts the Delhi Police said it blocked amplified anything that mattered. Readiness is one thing; mobilisation is another. The grievance data establishes the first beyond doubt. Parts 3 and 4 turn to the money and the networks behind the second, and will be as careful with the evidence there as this part has tried to be here.
Method and data
Grievance shares use the catalogue described in Part 1 (217 protests, 2000 to 2026, one main grievance each, at least two sources per row), published on the Data and evidence page. The examination record counts leaks, cancellations and re-tests of national and state examinations from 2017, from official notices and press reports, and is not exhaustive. Unemployment figures are the Ministry of Statistics' monthly Periodic Labour Force Survey bulletins, current weekly status. Inflation is MoSPI's consumer price index (new series, 2024 base) and the Office of the Economic Adviser's wholesale price index; fuel prices are PPAC's Delhi retail series. Industrial disputes are the Labour Bureau's series as published in the Economic Survey and Labour Bureau releases; 2024 has not been published. Tariff and export figures are from the White House, the Gem and Jewellery Export Promotion Council and industry bodies; job-loss figures are industry estimates, as no official estimate exists. The monthly protest series is ACLED's aggregated weekly export for India to 19 September 2026, demonstrations defined as in Part 1; September 2026 is excluded from the monthly chart as incomplete. The correlation reported is Pearson's, on 120 months with both series.
Comments
No comments yet. Be the first.
Comments are closed on this article.