
This is the first part of a research series on protest in India. The series asks who is protesting, why now, who pays and who amplifies, and how much of it is engineered. Before any of that can be asked, one question has to be answered with numbers rather than impressions: are Indians protesting more than they used to?
The short answer is yes. Every source that counts protests shows a rise, and the years since 2024 are the busiest on record. This brief sets out those counts, says how far back each one reaches, and separates them from a different series, the police count of riots, which has fallen and which is often mistaken for a count of protest.
How a protest gets counted
India has no single official register of protests, so the answer has to be assembled from three sources that count the same thing in different ways.
The first and best is the Armed Conflict Location and Event Data project, ACLED, which has recorded every protest and riot reported in the Indian press, by date, district and type, since January 2016. It is the series that academics use. It begins in 2016 and not before, so it can say what happened over the last decade but not over the last two.
The second is the police's own count. Each state police force reports the number of agitations it handled to the Bureau of Police Research and Development, which published aggregate figures until 2017. These counts are far larger than ACLED's, because they include every local demonstration a police station logged, and they are the only official measure of protest that exists for the years before 2016.
The third is the catalogue built for this series: one row for every nationally significant protest since 2000 that could be documented from press and official sources, 217 rows at the time of writing, each with at least two sources, the police, organiser and press crowd estimates kept apart, the deaths, the outcome and the nearest election. It counts the protests that mattered, not all protests, and it reaches back to 2000.
A protest, in all three, is a public demonstration: a march, a sit-in, a hunger strike, a road or rail blockade, a bandh observed on the street. A riot, which this brief turns to at the end, is something else: a violent clash that leads the police to register a case under the rioting sections of the penal code. The distinction matters, because the two series move in opposite directions.
What the counts show
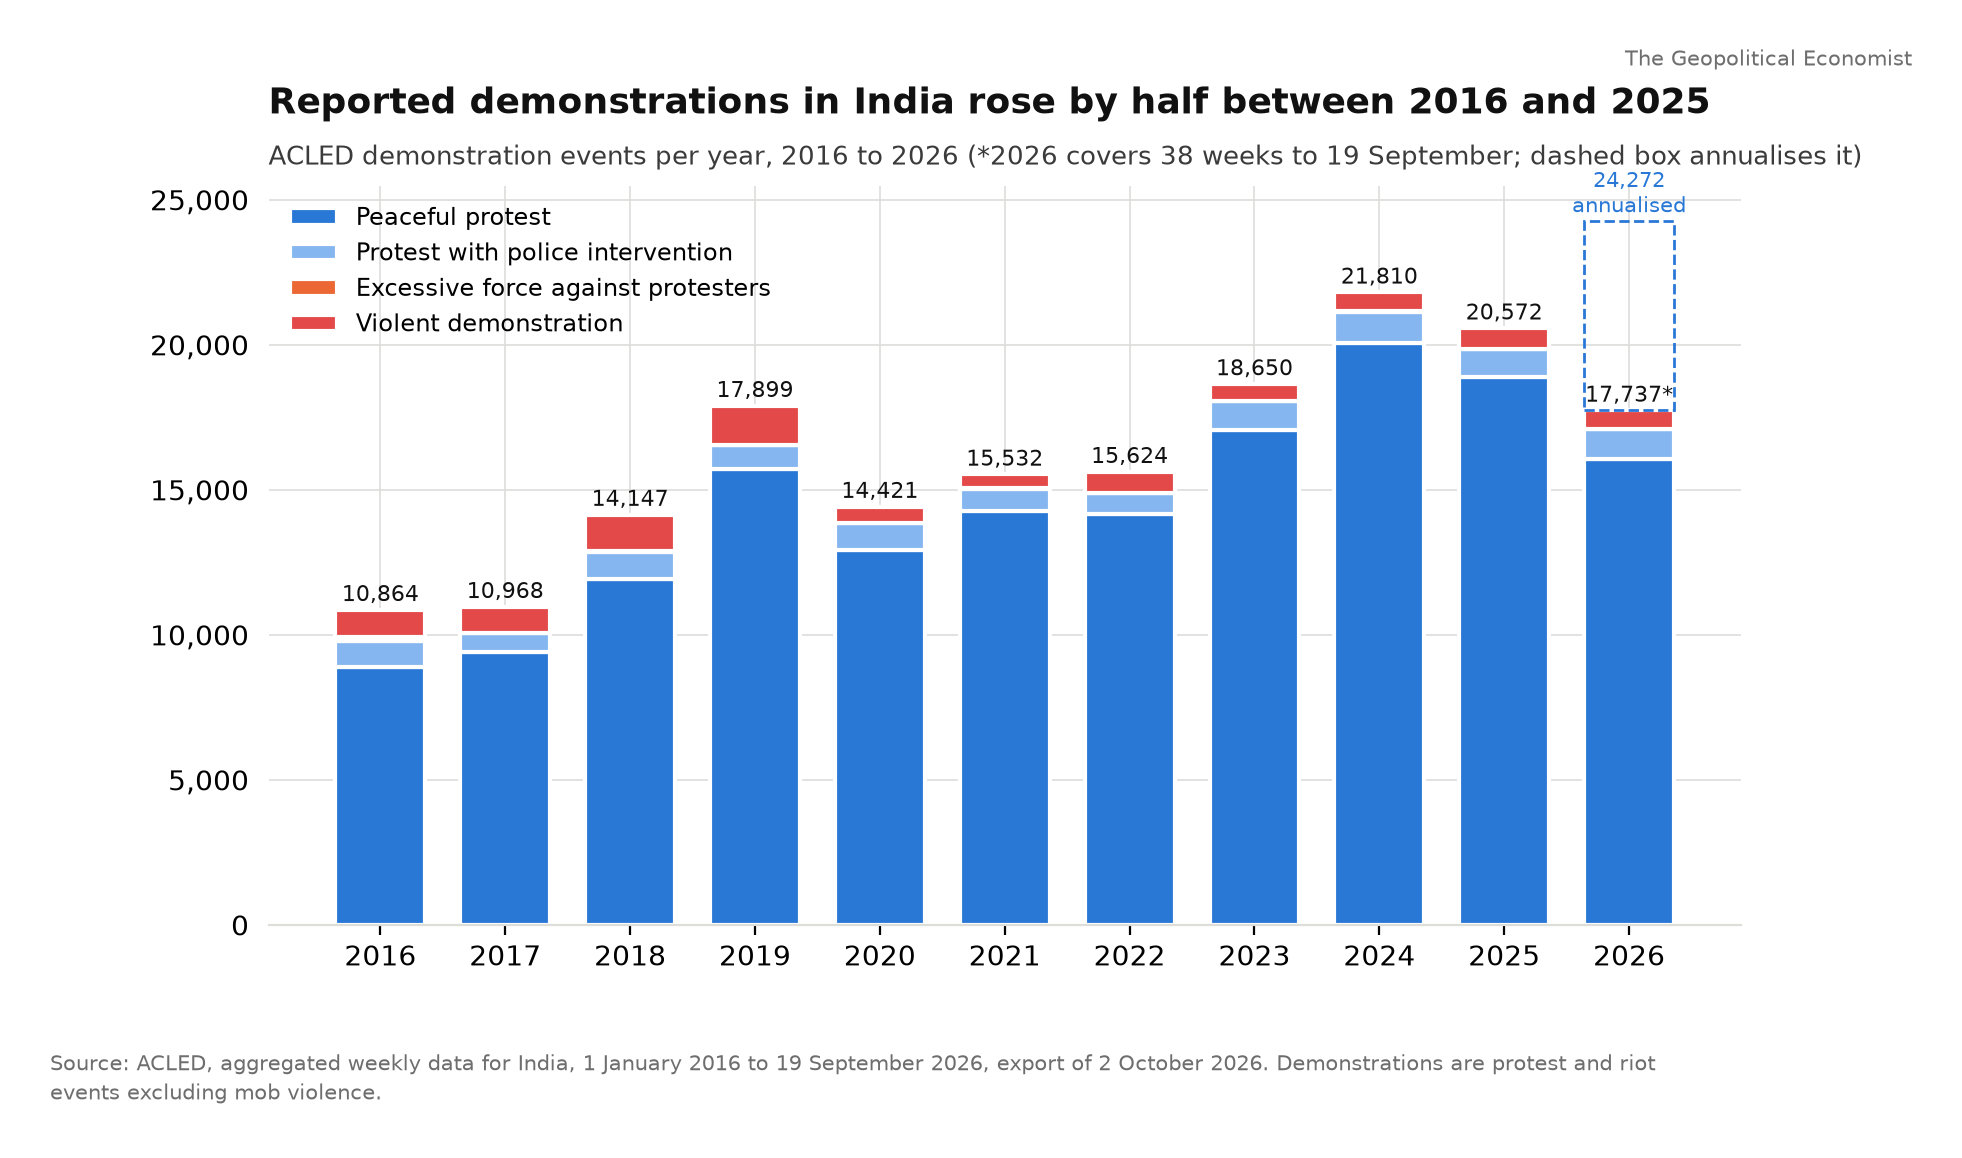
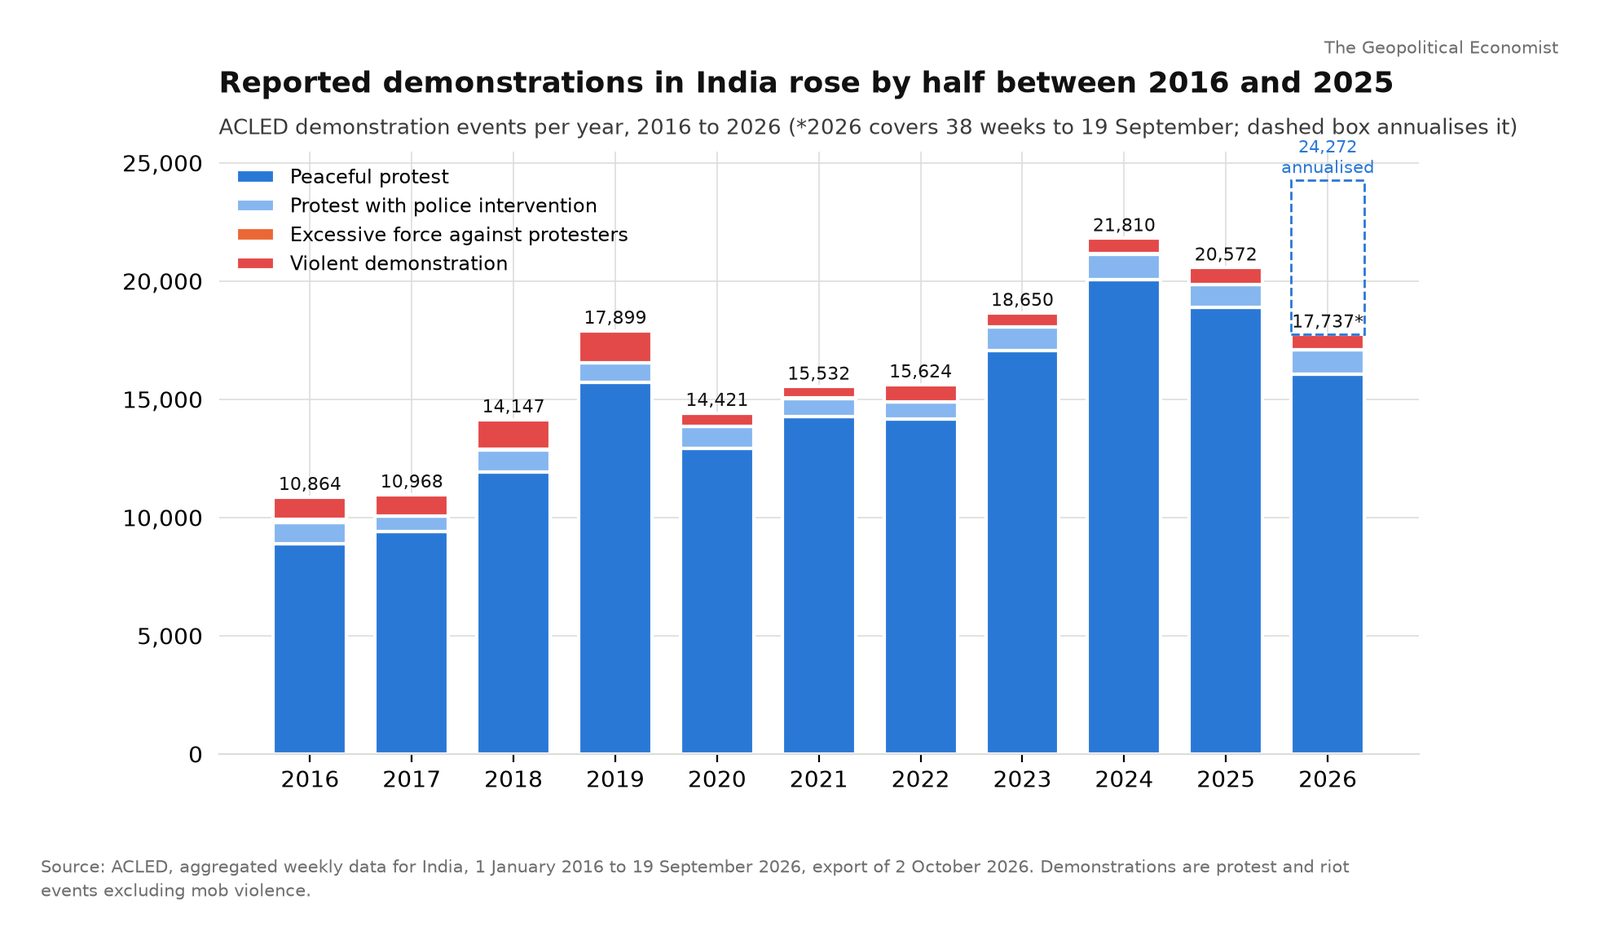
ACLED counted 10,864 demonstrations in India in 2016 and 20,572 in 2025. The count rose to 17,899 in 2019, the year of the citizenship-law protests, fell during the pandemic, and has risen every year since 2022: 15,624 that year, 18,650 in 2023, and 21,810 in 2024, the highest in the series. The first 38 weeks of 2026 produced 17,737, which is about 24,000 at an annual rate and would be a new record. Over the decade the number of demonstrations rose by roughly half, and the level of 2024 to 2026 is about a third above the level of 2019 to 2022.
The police count reaches further back and tells the same story. Between 2009 and 2014 state police forces recorded about 420,000 agitations, an average of 200 a day, and the annual figure rose by 55 per cent over those five years. The last aggregate the Bureau published, for 2017, was an average of 317 protests a day, or about 115,000 in the year. The Bureau's figures and ACLED's are not comparable in level, because the police log every small local demonstration and ACLED records only those that reach the press, but both rose, and the police series was rising for a decade before ACLED began.
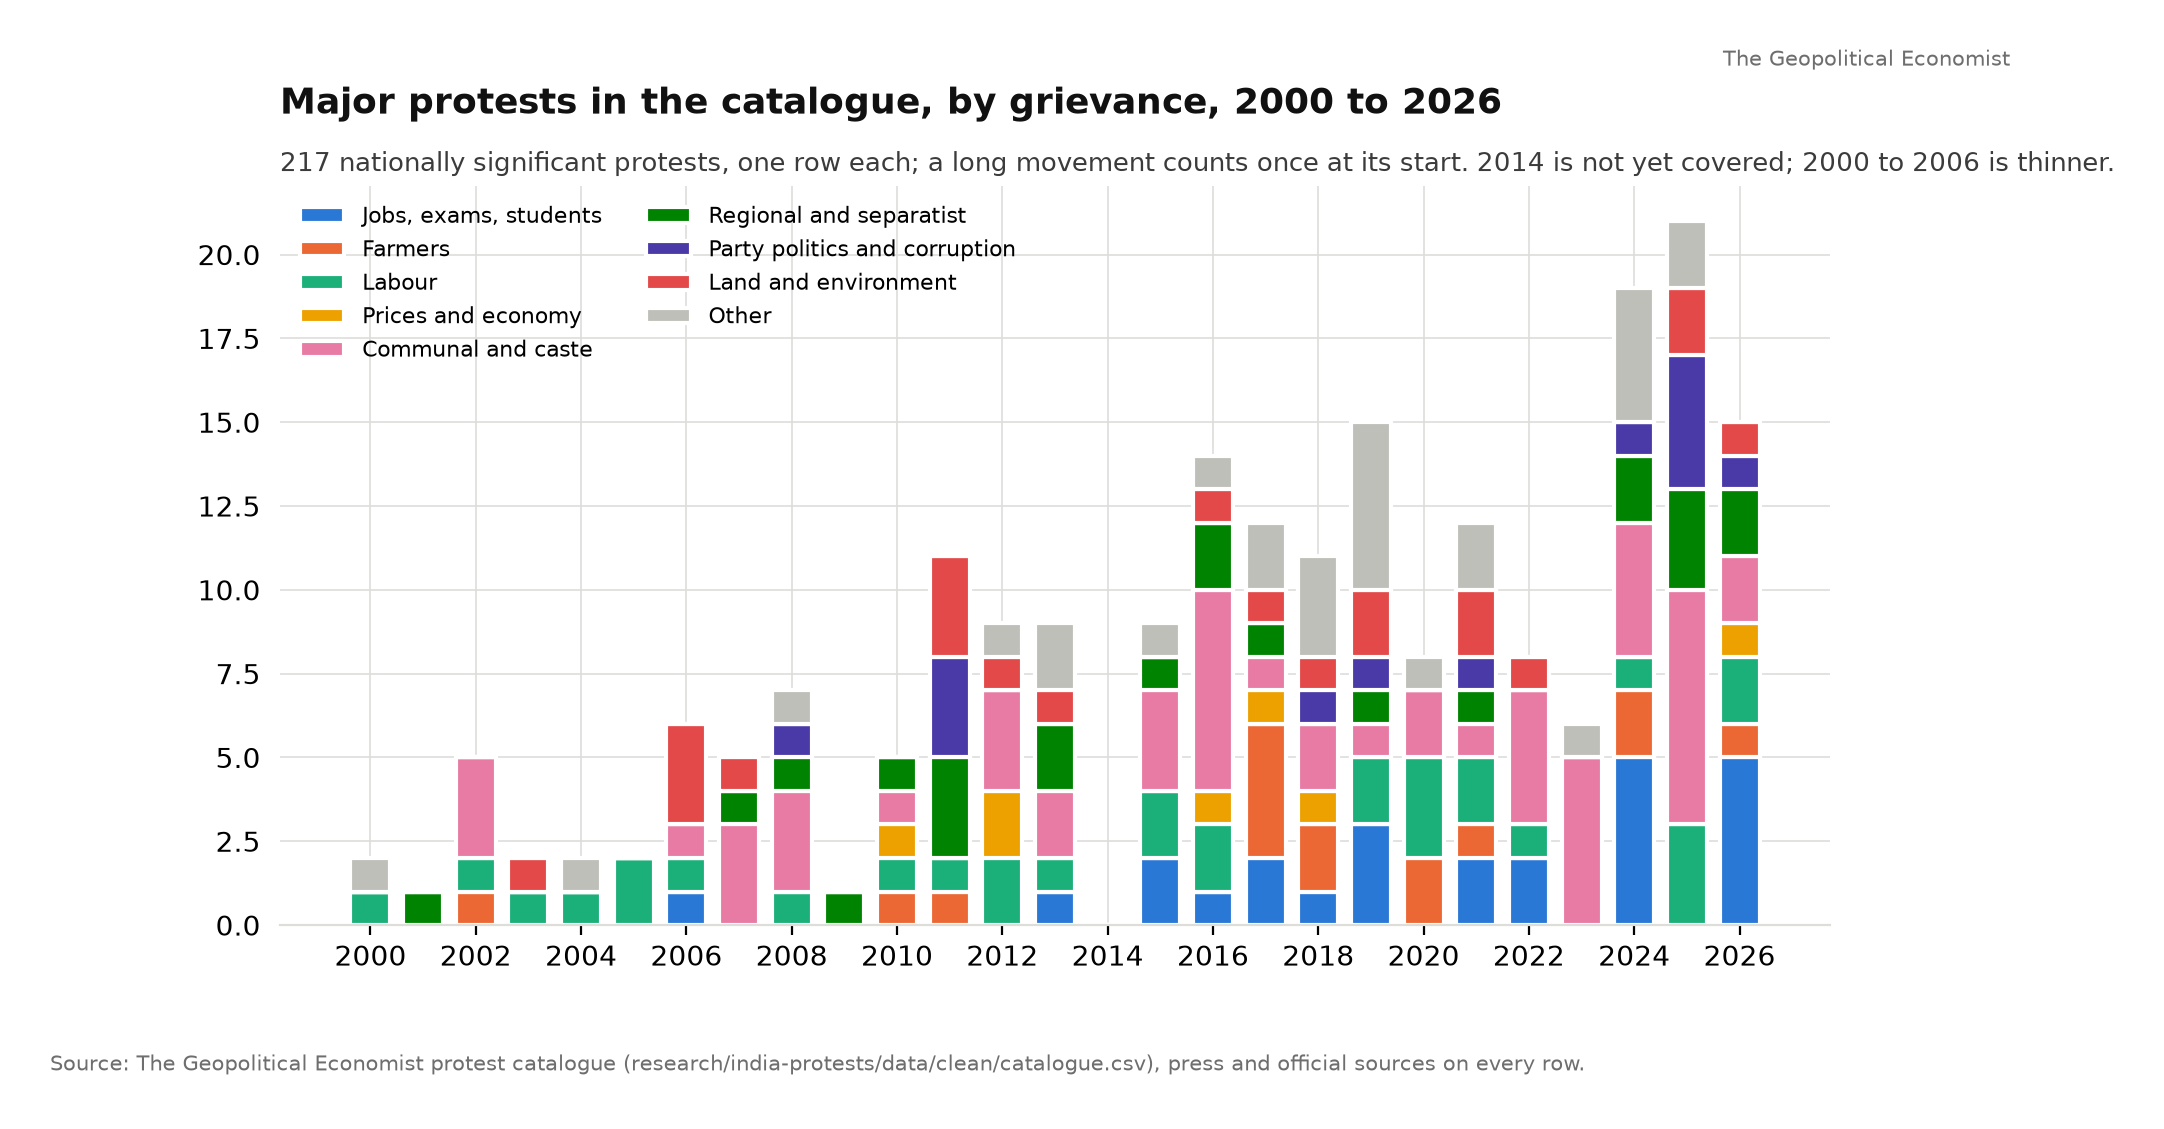
The catalogue of major protests rises in steps. It records about seven a year from 2007 to 2013, the period of the Telangana movement, the anti-corruption summer of 2011 and the Nirbhaya protests; between 8 and 15 a year from 2015 to 2022, an average of about 11; and then 19 beginning in 2024, 21 in 2025 and 15 in the first nine months of 2026, roughly 20 a year. The rate of nationally significant protests has roughly doubled since the late 2010s. The years before 2007 are thinner in the catalogue, because a protest in 2003 had to be reported in print to survive, so the earlier steps are partly coverage; the step since 2024 is not, because the press of 2019 was as dense as the press of 2025.
Three counts, three methods, one direction.
When, who and where
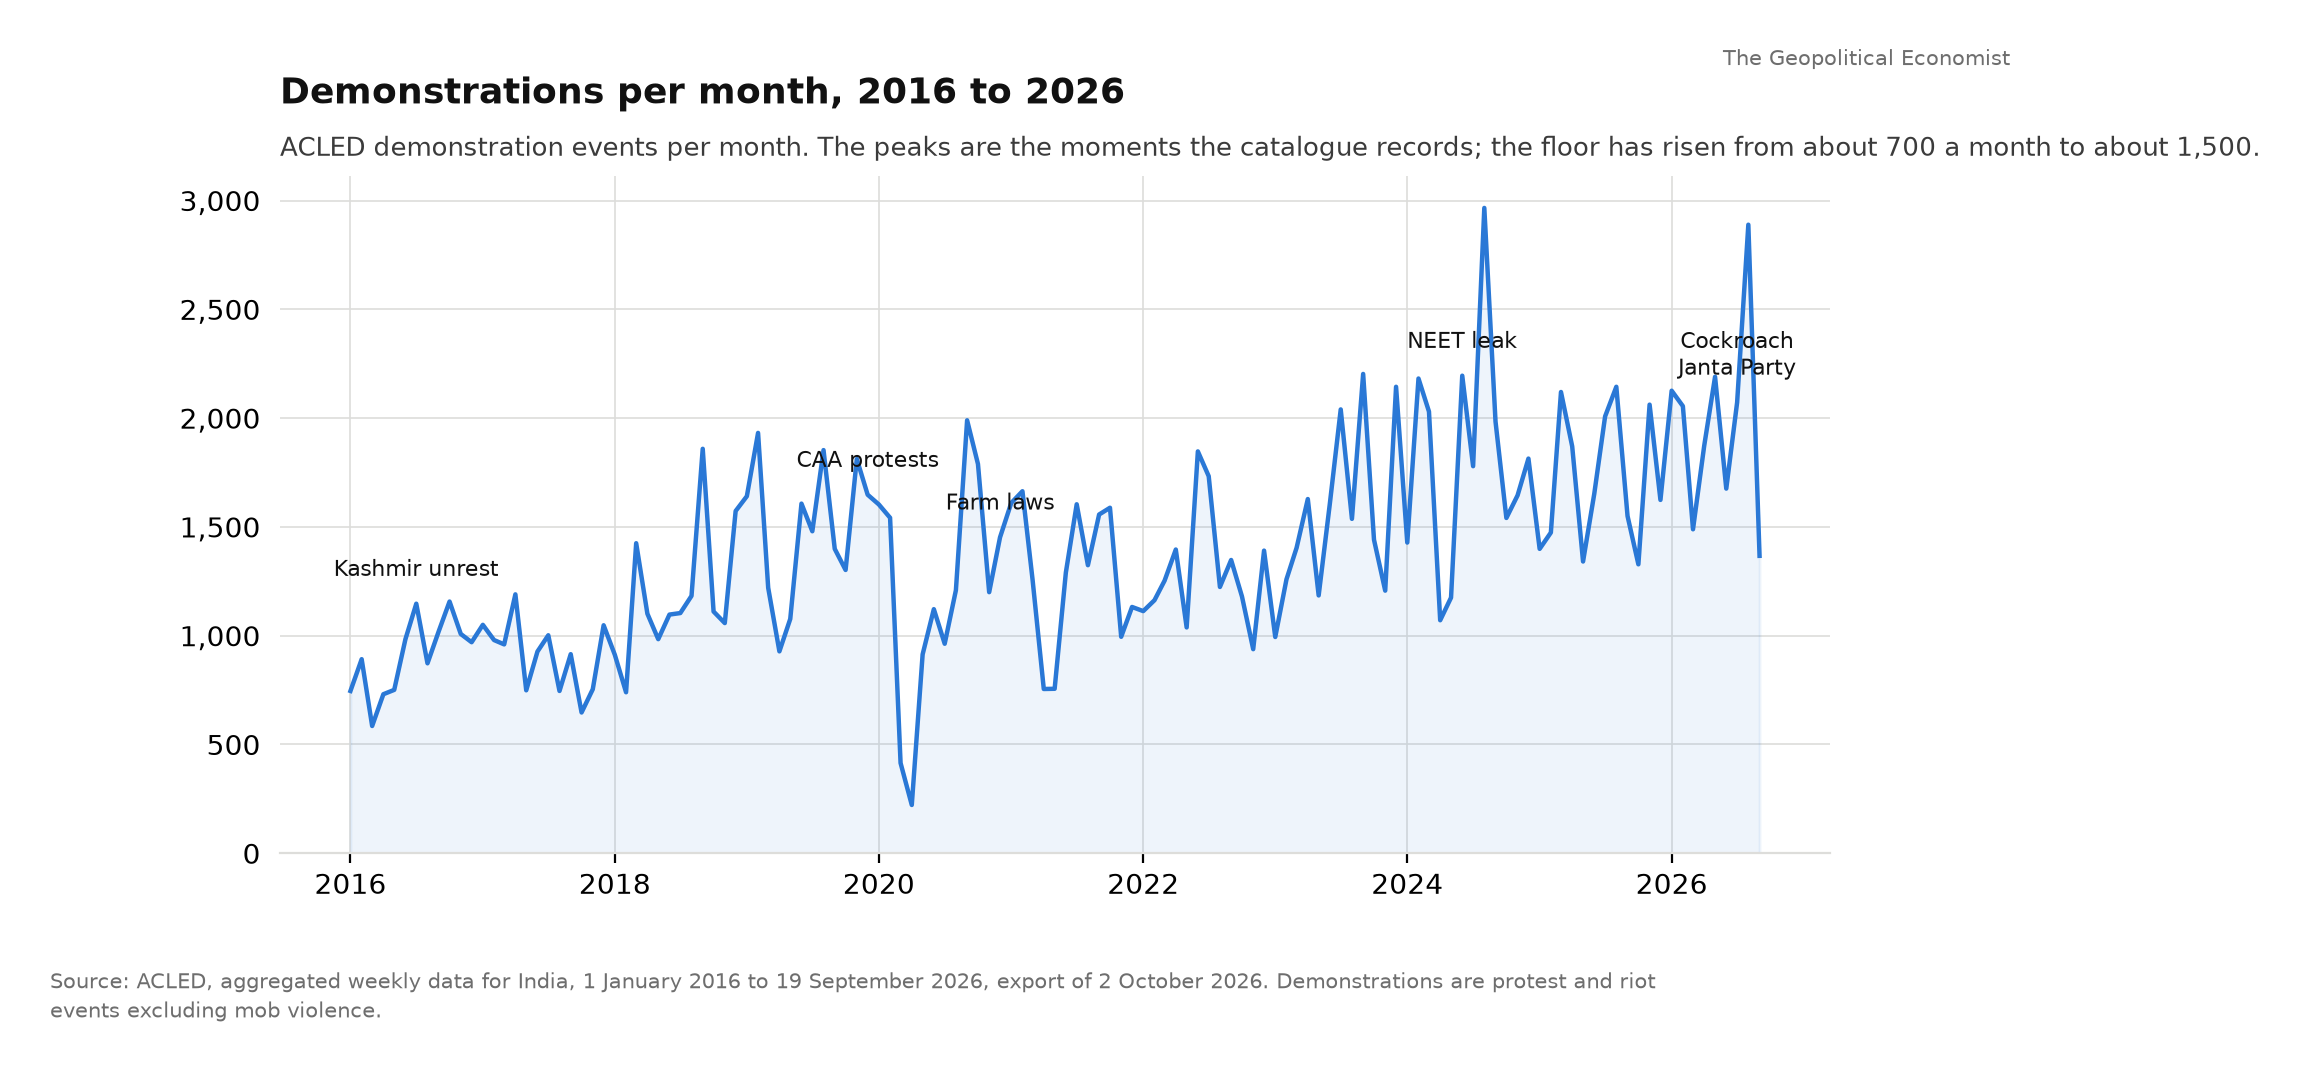
The monthly series shows why the sense of a new age of protest is so strong. The peaks are the events everyone remembers: Kashmir in 2016, the citizenship law in December 2019, the farm laws in late 2020, the NEET leak in June 2024, August 2024 after the Kolkata rape, and August 2026 after the Cockroach Janta Party's summer at Jantar Mantar, which ended with the resignation of the Education Minister on 25 July. But the floor has risen too. A quiet month in 2017 had about 700 demonstrations; a quiet month in 2025 had about 1,500. Protest has become a routine instrument of politics, not an exceptional one.
The composition of protest has changed with its volume. In ACLED's record, peaceful protests went from 8,895 in 2016 to 18,893 in 2025, while violent demonstrations fell from 937 to 706 and deaths in demonstrations fell from 170 in 2016, most of them in Kashmir, to 15 in 2025 and 4 in the first nine months of 2026. In the catalogue, jobs, examinations and students are the largest single grievance since 2014, with 23 major protests against 21 communal, 18 labour and 17 caste, and they dominate the years since 2024: the NEET and UGC-NET cancellations of 2024, the Rajasthan and Bihar recruitment protests, the Ranchi agitation of this summer, and the Cockroach Janta Party movement itself. The protests of the last three years are larger, younger, more peaceful and more often about the state's ability to run a fair examination than about anything else.
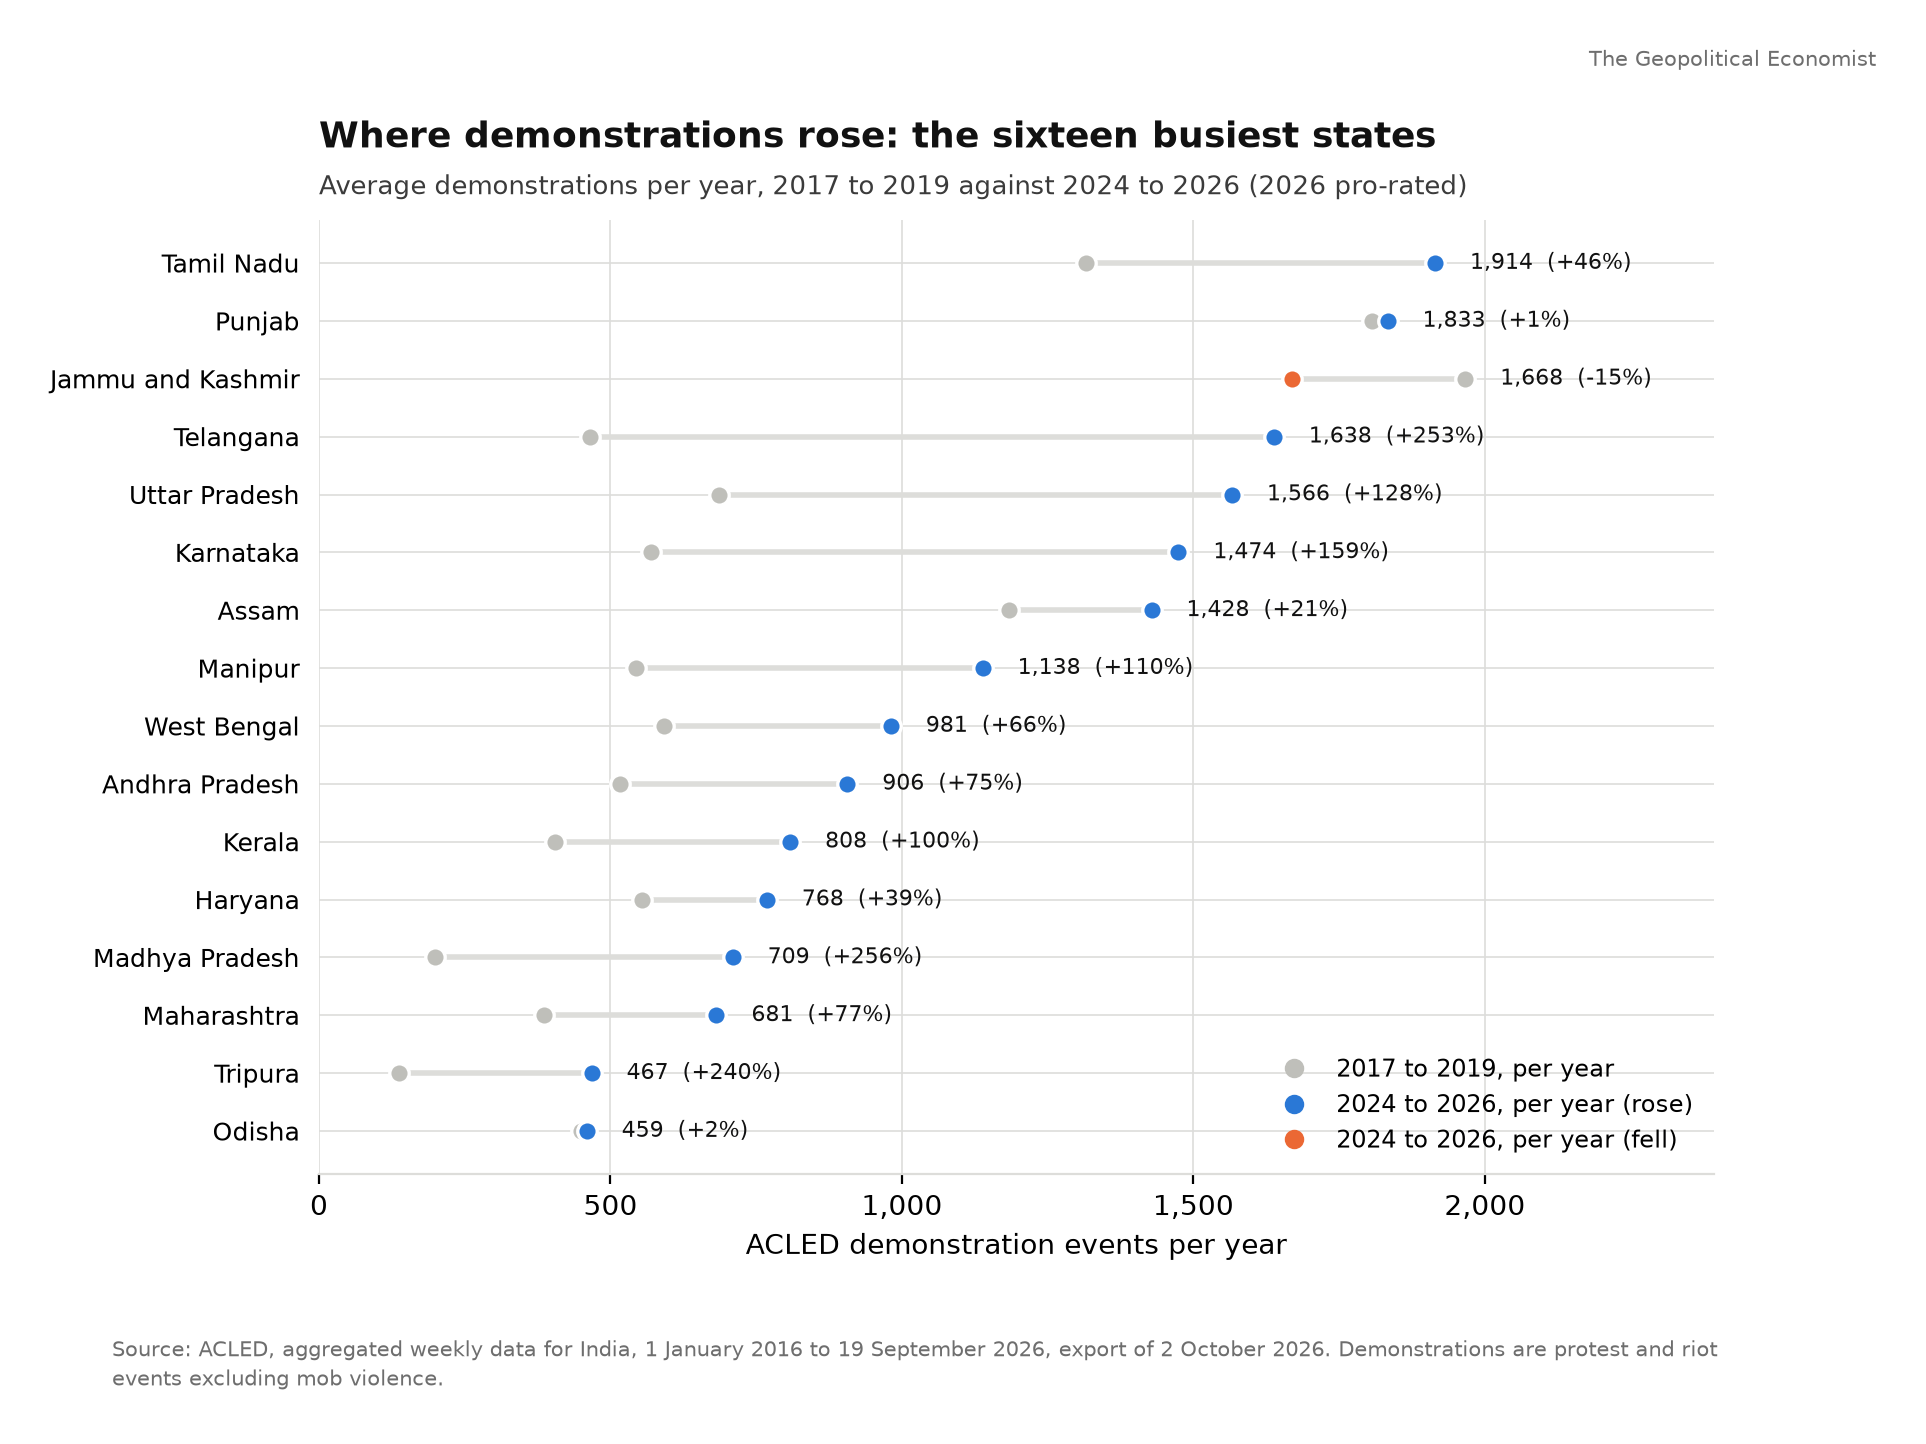
The geography has shifted away from the places that dominated the late 2010s. Jammu and Kashmir, which led the country from 2016 to 2019, is down by about a sixth. The largest rises are in Telangana, Madhya Pradesh, Karnataka, Uttar Pradesh and Manipur, and Tamil Nadu is now the state with the most demonstrations. Fourteen of the sixteen busiest states recorded more demonstrations a year in 2024 to 2026 than in 2017 to 2019; Jammu and Kashmir recorded fewer, and Punjab and Odisha about the same. The rise is national, not a story about one or two states.
The election calendar explains less than is often assumed. Of the 217 catalogued protests, 44 began within six months of a Lok Sabha poll or an assembly poll in the state concerned. The rest did not. Protests cluster around examination results, harvest seasons and specific triggers far more than around voting.
Protests are rising. Riots are falling.
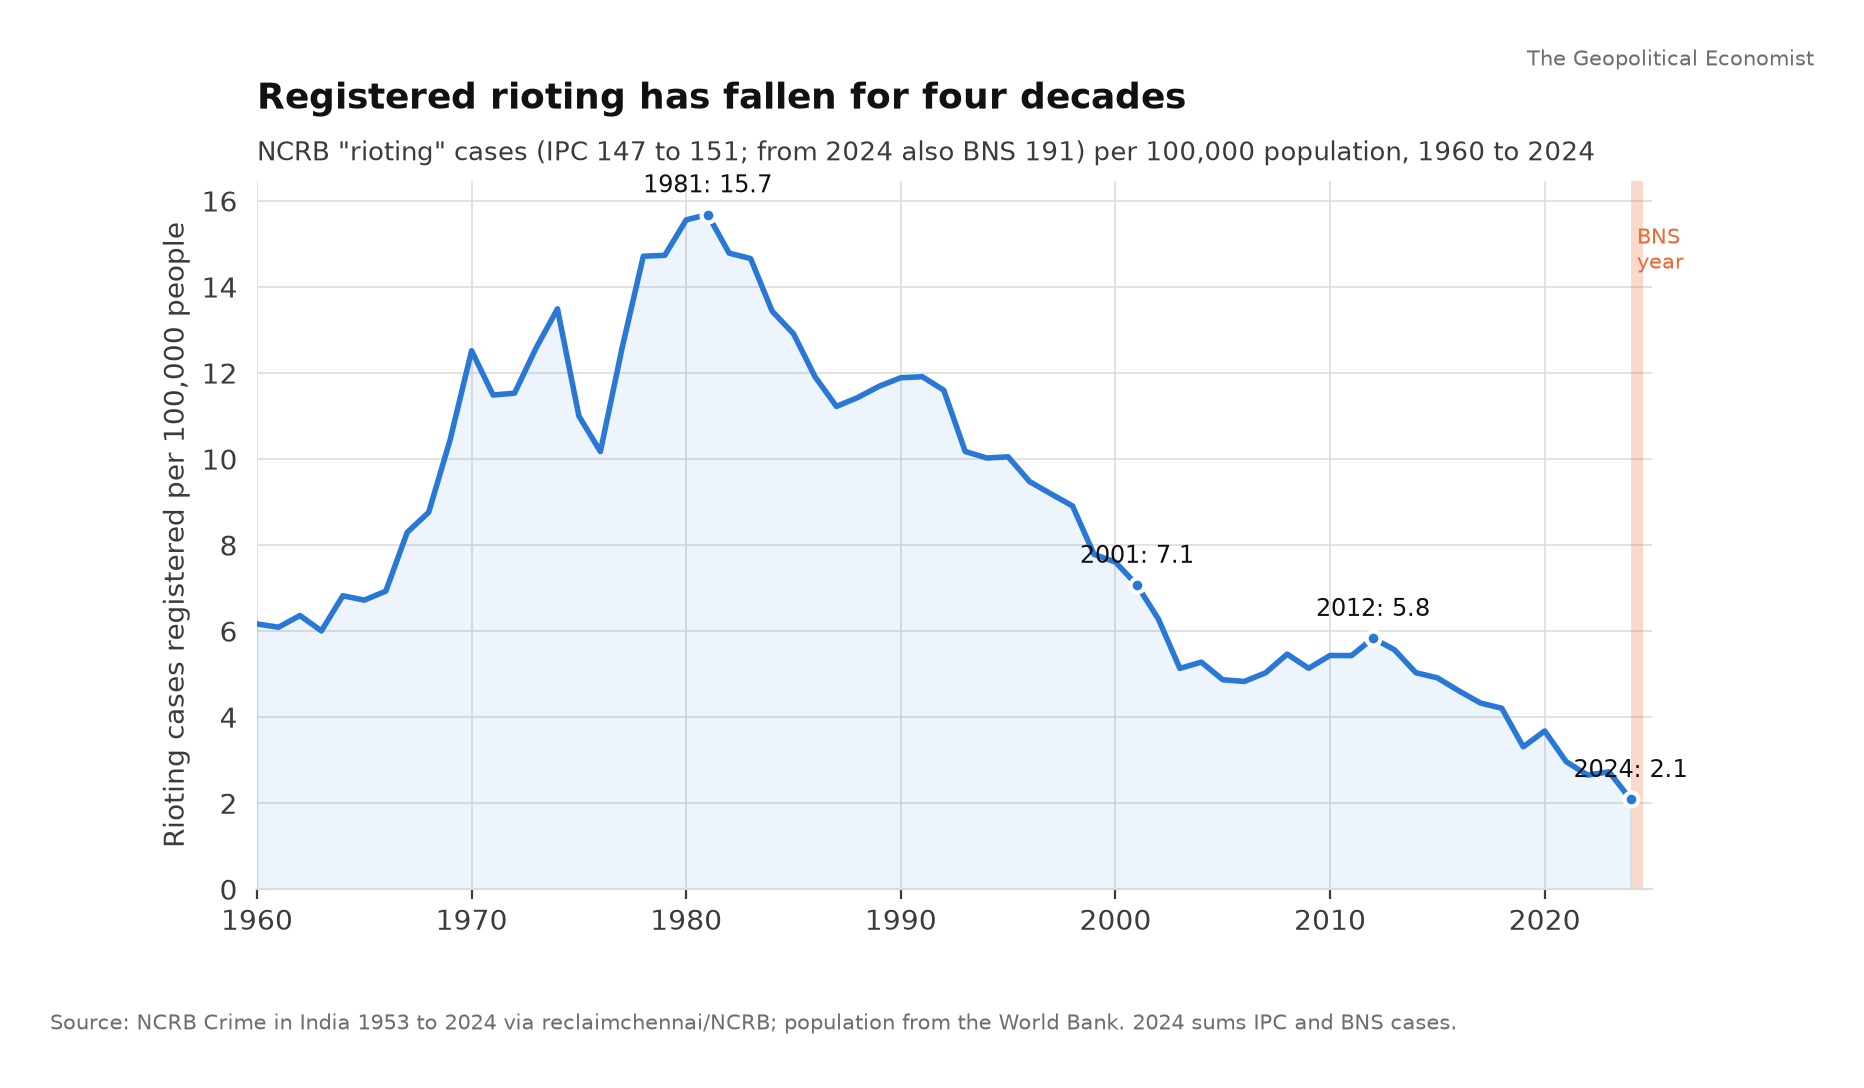
The one long official series that is often cited as a measure of unrest is the National Crime Records Bureau's count of rioting cases, which runs back to 1953. It shows the opposite trend: registered rioting per 100,000 people peaked in 1981, had halved by 2001, and fell to 2.1 in 2024, the lowest in the series. Taken alone, that chart suggests a country growing calmer, and it is the chart most often used to argue that the sense of rising protest is an illusion.
It measures something different. A rioting case is a First Information Report filed when a crowd becomes violent. A peaceful march of fifty thousand people produces no entry. A fight over a field boundary in a village produces one. From 2014 the Bureau recorded the motive the police attributed to each riot, and the result is that most registered riots are private quarrels over land, money and family, not protests. The motives that do resemble protest, communal, political, caste, agrarian, student, and from 2017 "during andolan or morcha", peaked at 11,755 cases in 2017 and fell to 2,930 in 2024.
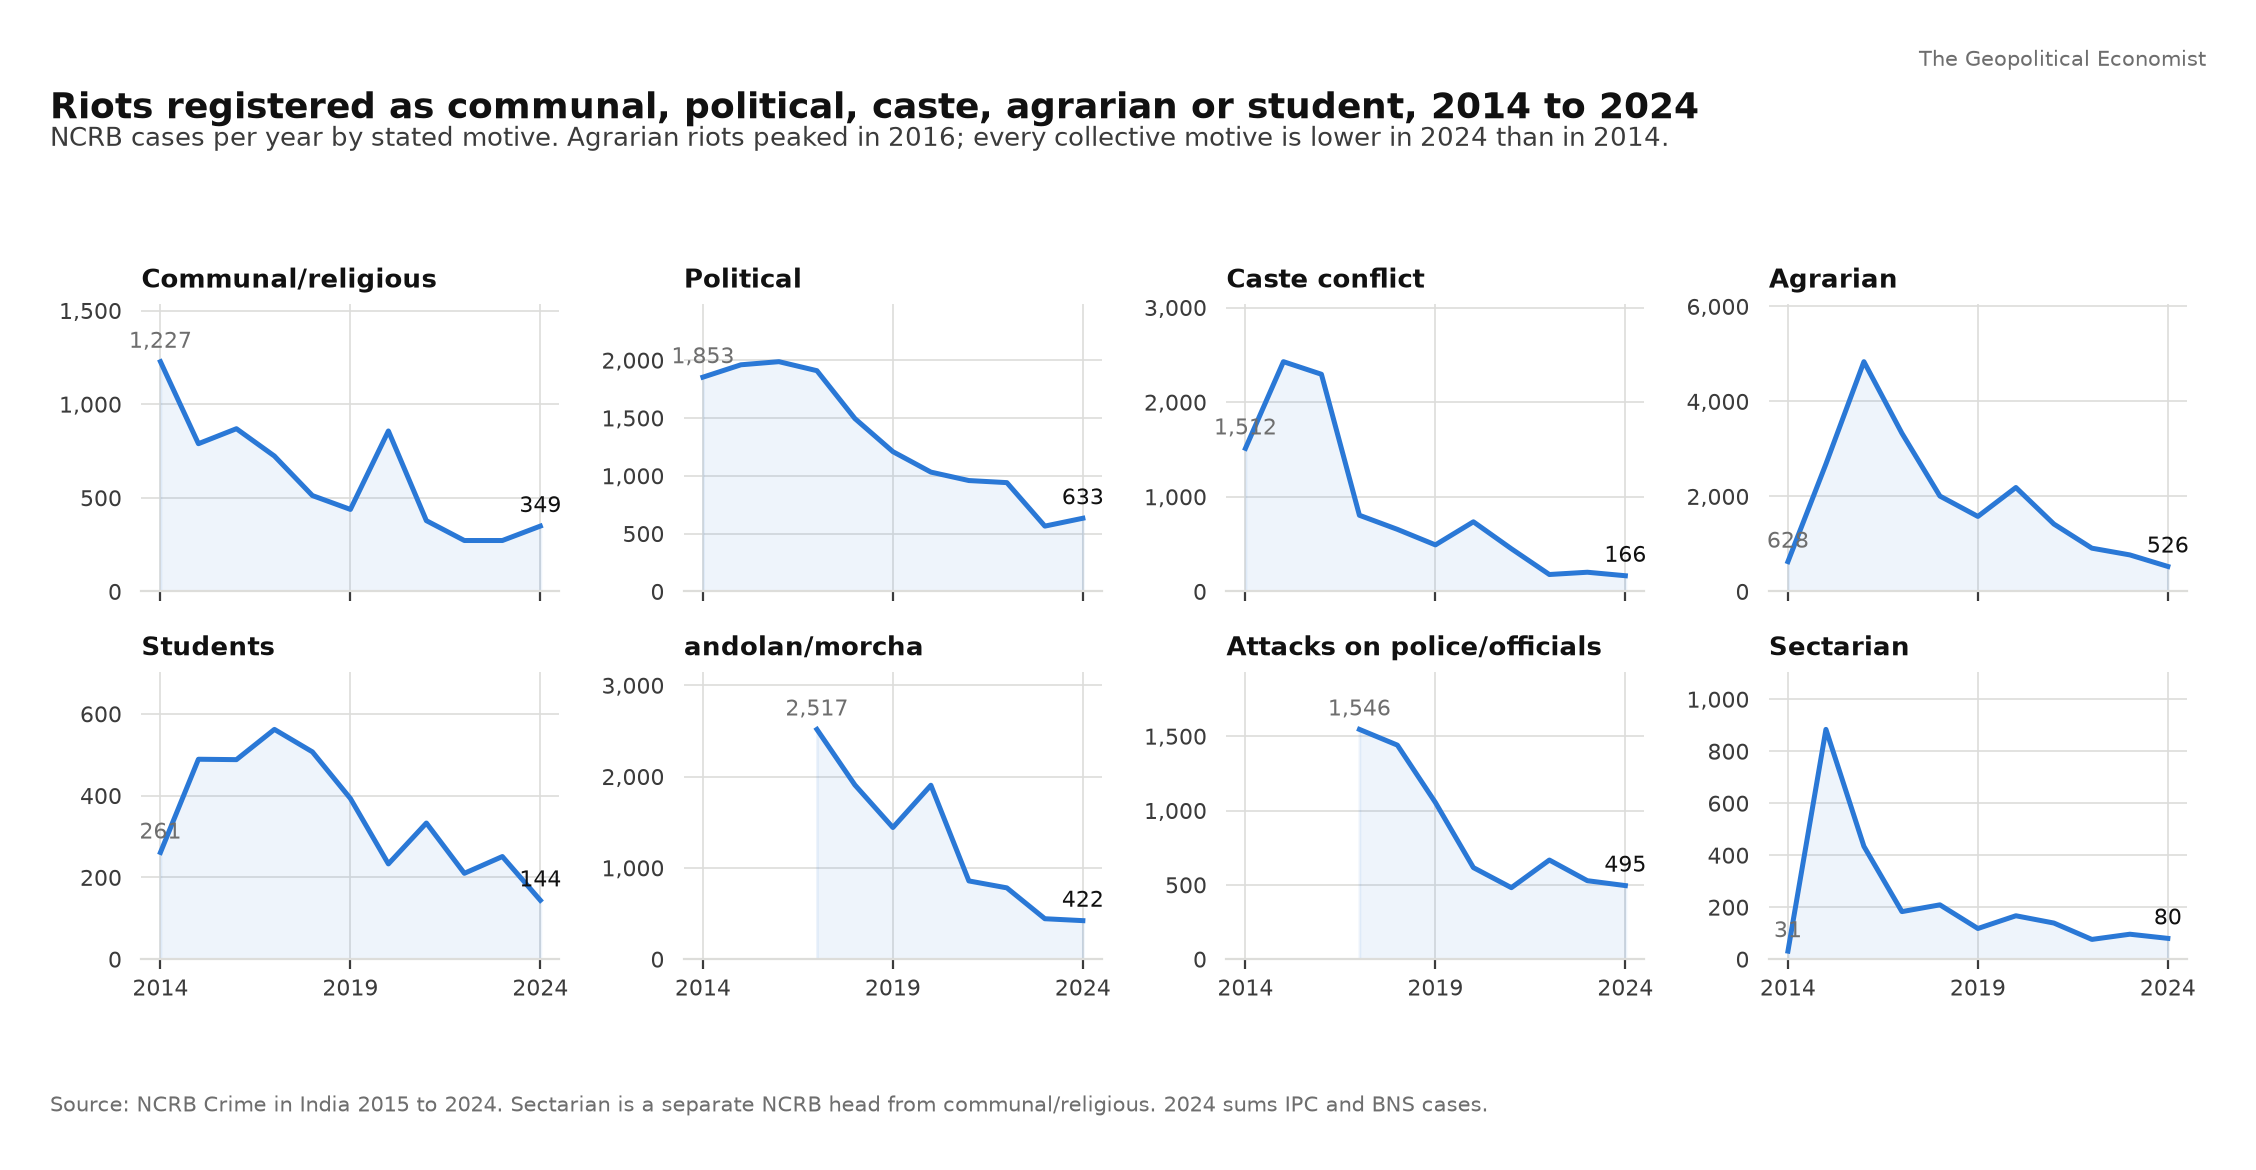
Read together, the two series do not contradict each other. They describe one change from two sides. Indians are demonstrating more often and clashing less often. The number of demonstrations has risen by half in a decade while the number of violent ones has fallen, the number of deaths in them has fallen by nine tenths, and the police register fewer riots of every political kind. The same is true of the state's emergency response: government-ordered internet shutdowns peaked at 134 in 2018 and were down to 65 in 2025, the lowest since 2017. More protest, less violence, less repression by shutdown. That is the finding, and it is the opposite of the picture in which rising protest means rising disorder.
How sure can we be
Two cautions apply, and the series will keep them in view.
The first is visibility. ACLED counts what the press reports, and the Indian press reports more than it did: a demonstration in 2026 is filmed from a thousand phones and reaches a newsroom within the hour. Some of the rise in any press-based count is better reporting of the same activity. Three things argue against visibility as the whole story. The police count, which does not depend on the press, was rising before ACLED began. The catalogue, which counts only events large enough to be reported in any decade, rises in the same proportion. And the shift toward peaceful, repeated protest is not what better reporting of the same underlying activity would produce. The rise is real; its exact size is uncertain by perhaps a fifth.
The second is the series' own early years. ACLED expanded its Indian sources after it began in 2016, so part of the rise from 2016 to 2019 is the project catching up with the country. The rise since 2022, when coverage was mature, is 32 per cent to 2025 and about 55 per cent with 2026 annualised. That is the firmer number, and it is large enough on its own.
What this settles, and what comes next
India is protesting more. Every count agrees, the rise is national, it is led by the young and by grievances over examinations and jobs, and it has been accompanied by less violence, not more. The years since 2024 are the top of a trend that is at least a decade and a half old, not a break in it.
What the counts cannot say is why. A rising, peaceful, youthful, nationally distributed protest count is what one would expect in a young country where the examination system, the job market and the federal settlement are under strain. It is also what a campaign of amplification would try to produce. Part 2 of this series tests the first explanation against the grievance data: unemployment, exam leaks, prices and farm incomes. Parts 3 and 4 test the second against the record of foreign funding and of coordinated amplification, including the Delhi Police's claim of 23 July 2026 that it had blocked 480 Pakistan-based handles around the Jantar Mantar protest, a claim recorded in the catalogue with its rebuttals and with no court or ministry finding of funding behind it. Nothing in this part decides between the two explanations, and the series will not pretend otherwise.
Method and data
The dataset, scripts and charts are published with this brief in the repository folder research/india-protests. ACLED figures use the project's aggregated weekly export for India, 1 January 2016 to 19 September 2026, with demonstrations defined as ACLED defines them, protest and riot events excluding mob violence; 2026 figures are annualised from 38 weeks where stated. Police agitation counts are the Bureau of Police Research and Development's figures as reported by IndiaSpend and Scroll for 2009 to 2014 and by Singh, Hemrajani and Ahuja for 2017. The NCRB series was rebuilt from every edition of Crime in India since 1953, using the table archive compiled by Reclaim Chennai, with the later edition taking precedence where two report the same year; rates use World Bank mid-year population. The catalogue keeps police, organiser and press crowd figures in separate columns and never averages them; every row carries at least two sources; 2014 is not yet covered and 2000 to 2006 is thinner than later years.
Sources: ACLED (Armed Conflict Location and Event Data), India, 2016 to 2026, aggregated weekly data, accessed 2 October 2026; Bureau of Police Research and Development, Data on Police Organisations, via IndiaSpend (2016) and Scroll (2016) and Singh, Hemrajani and Ahuja, Journal of Urban Affairs (2023); NCRB, Crime in India, 1953 to 2024, via github.com/reclaimchennai/NCRB; SFLC.in Internet Shutdowns Tracker and Access Now #KeepItOn reports; World Bank population estimates; Election Commission of India; The Geopolitical Economist protest catalogue, 2000 to 2026, with its sources.
Comments
No comments yet. Be the first.
Comments are closed on this article.