Home / Research / Projects / Protest in India, 2000 to 2026
Research project · 2 of 6 parts published
Protest in India, 2000 to 2026
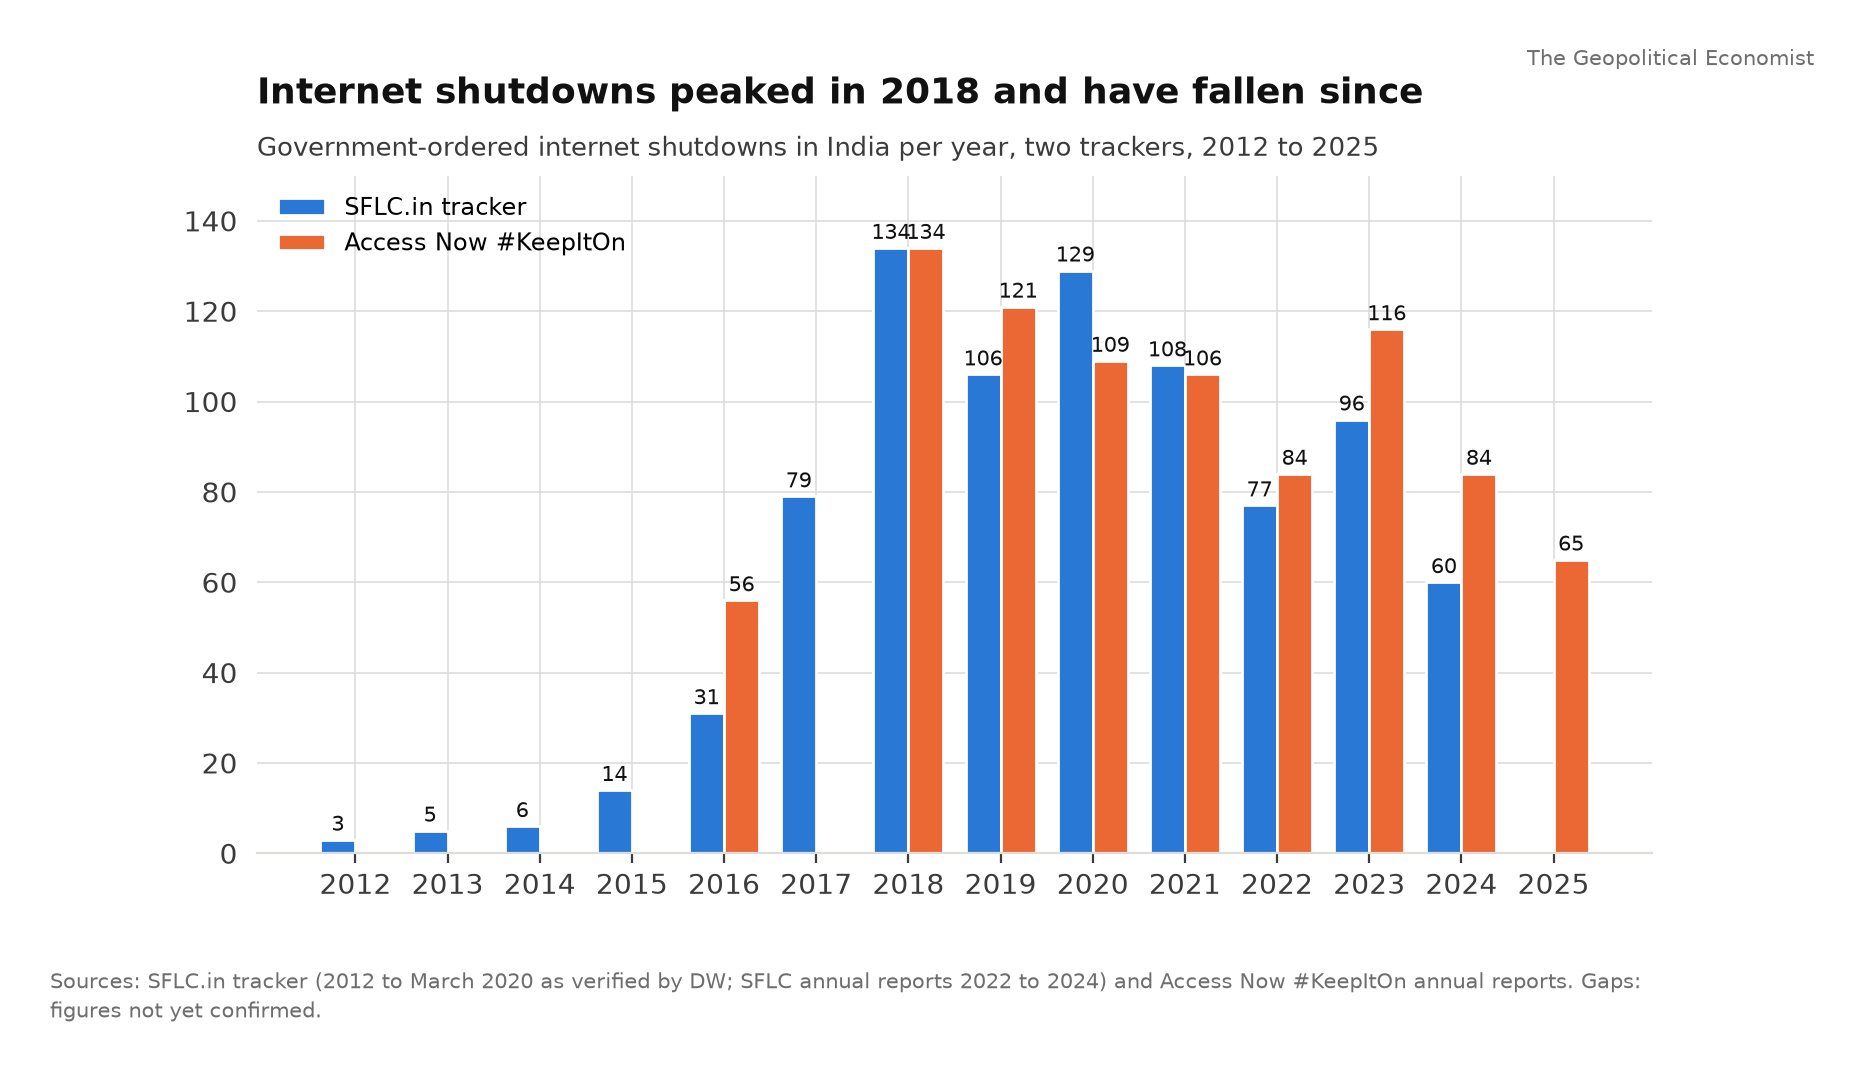
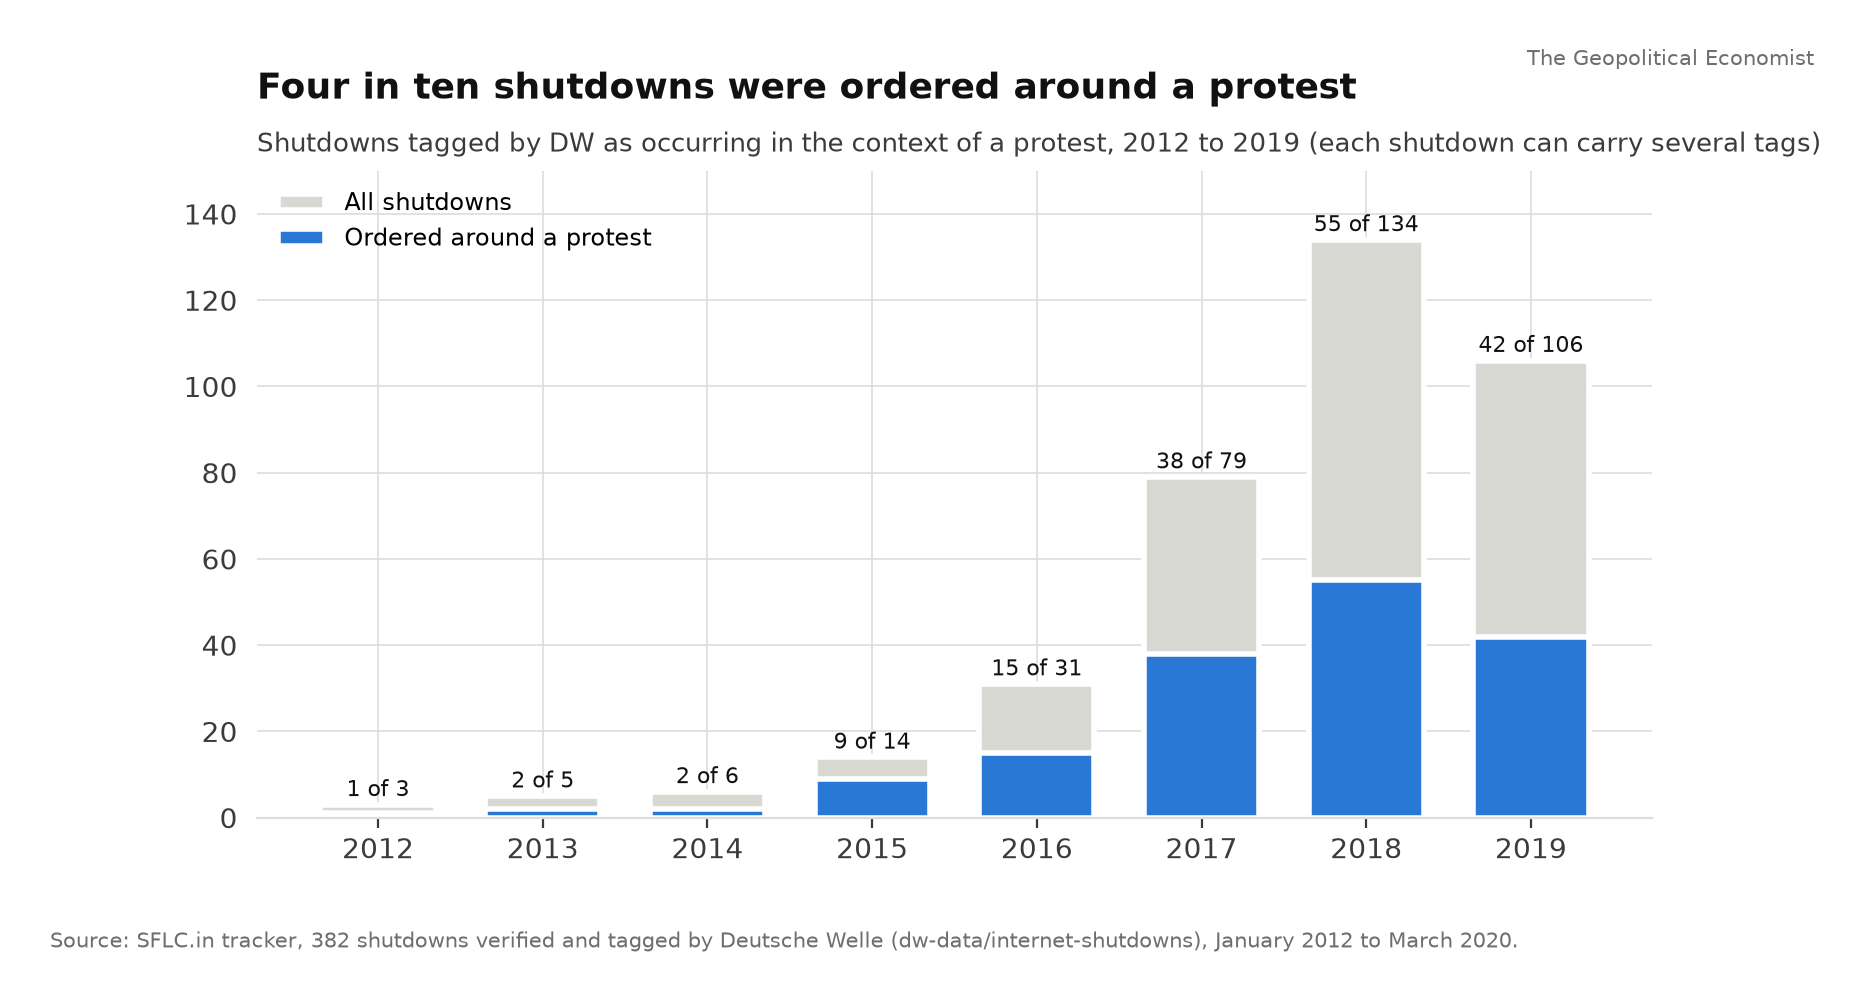
A six-part research series asking who is protesting in India, why now, who pays and who amplifies, and how much of it is engineered. Part 1 builds the dataset: ACLED demonstrations 2016 to 2026, the police agitation counts, NCRB rioting 1953 to 2024, internet shutdowns, strikes, an election calendar and a catalogue of 217 major protests with sources.
The series
- Part 1Are Indians Protesting More? Yes. Here Is the Evidence.
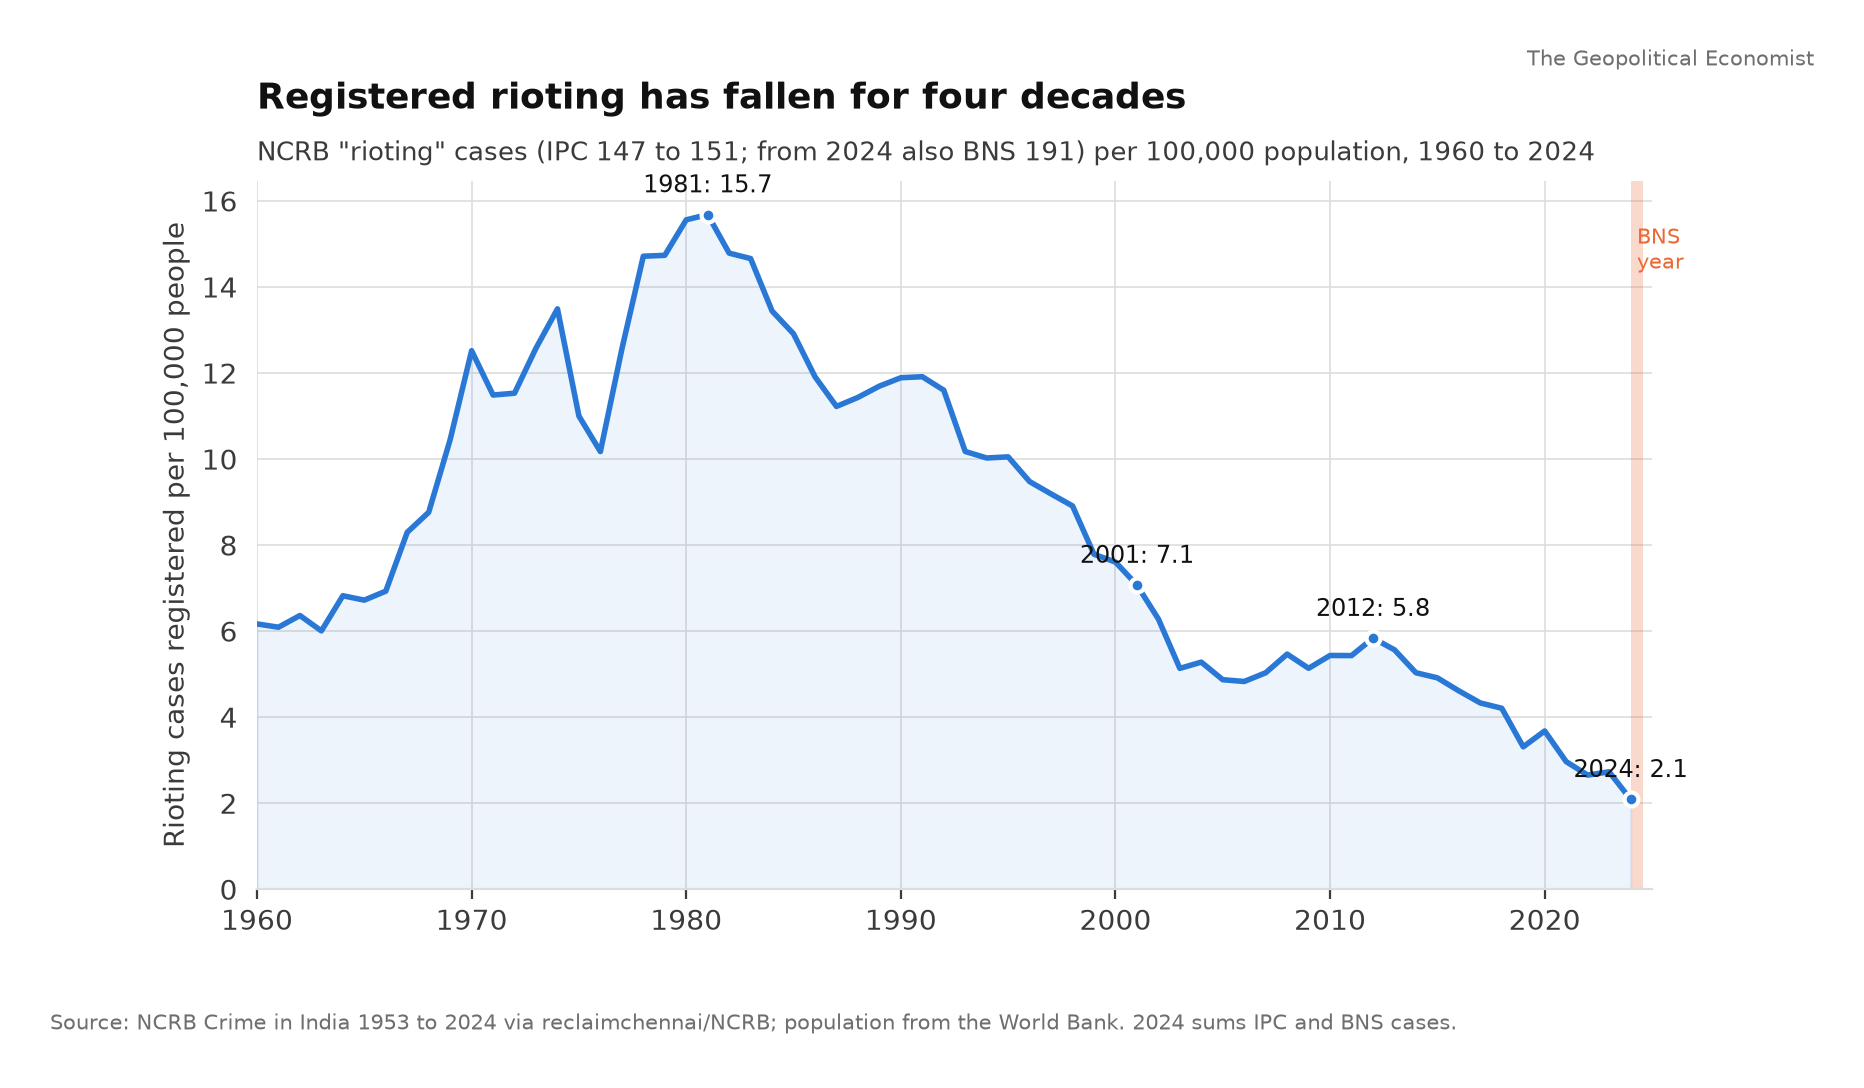
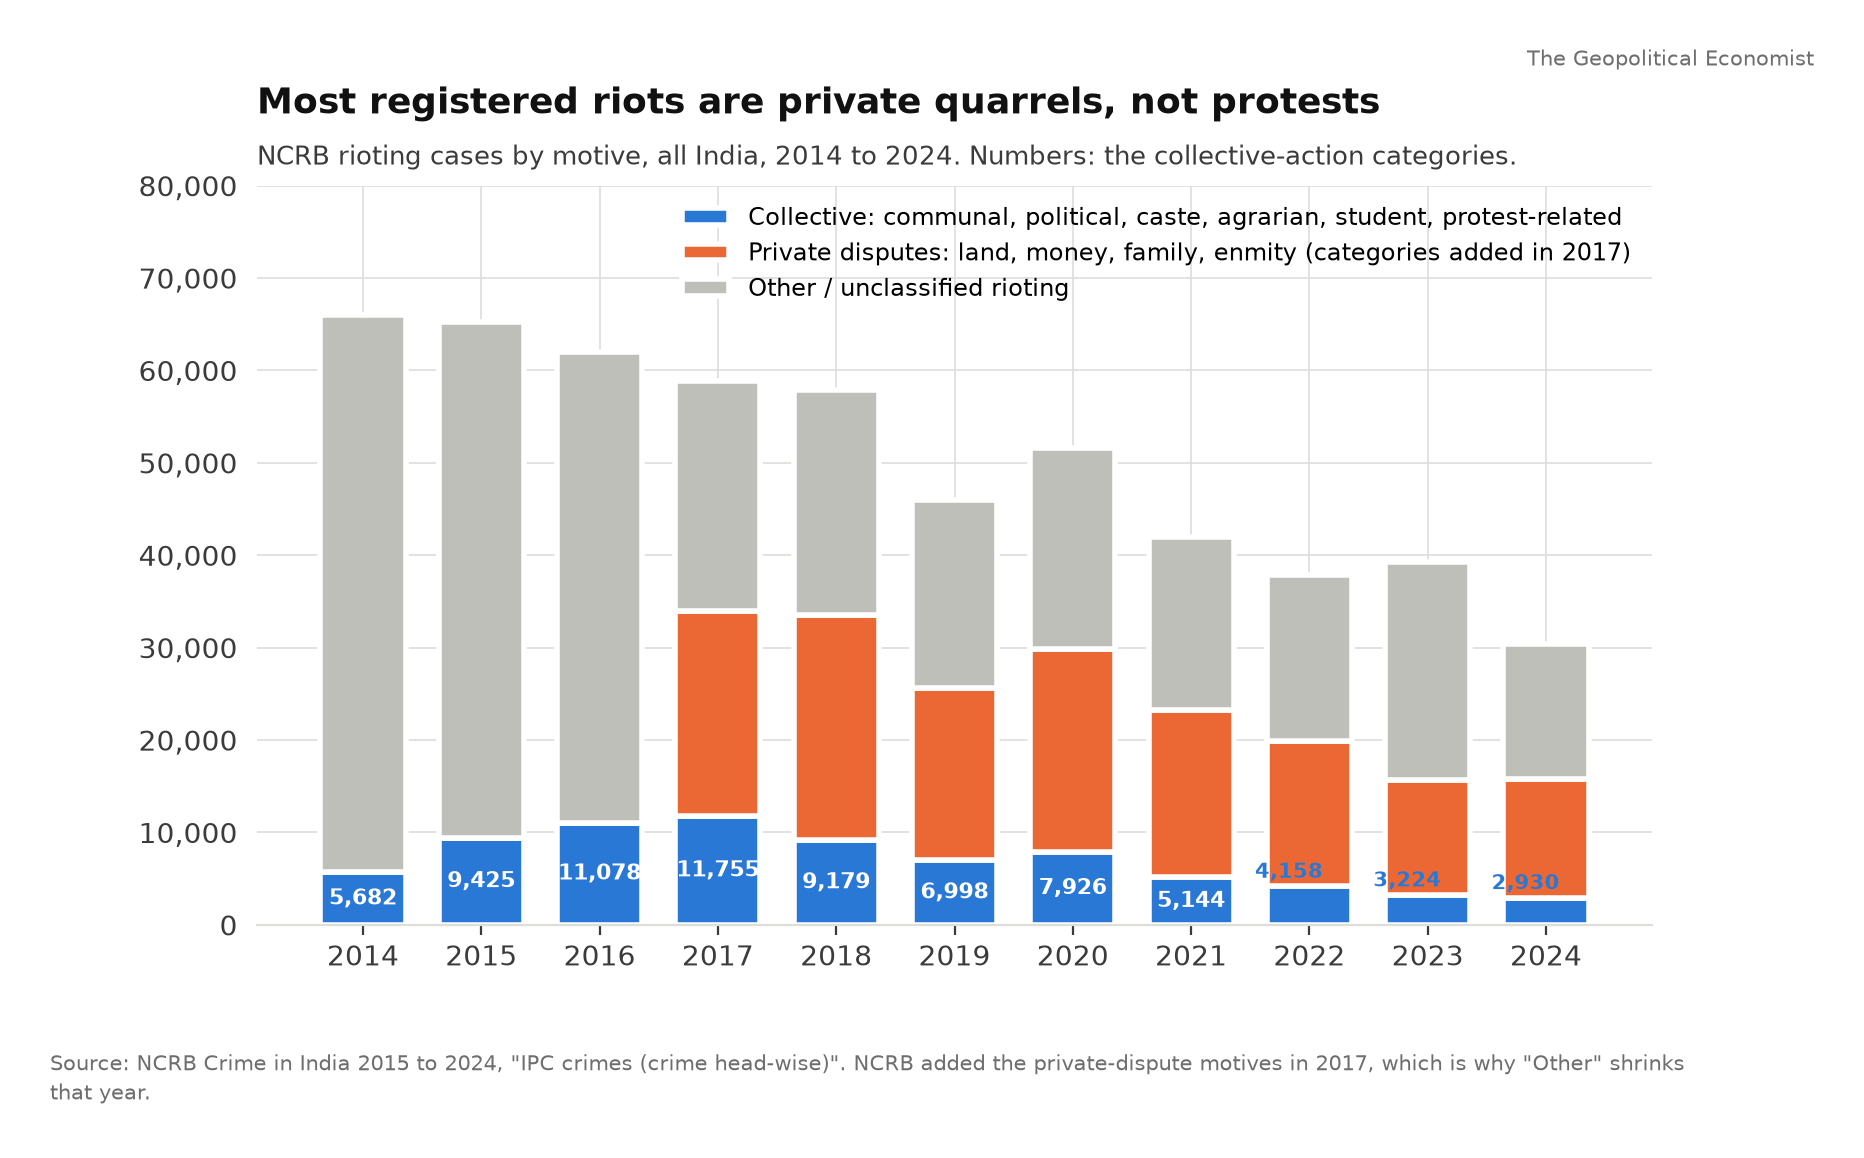
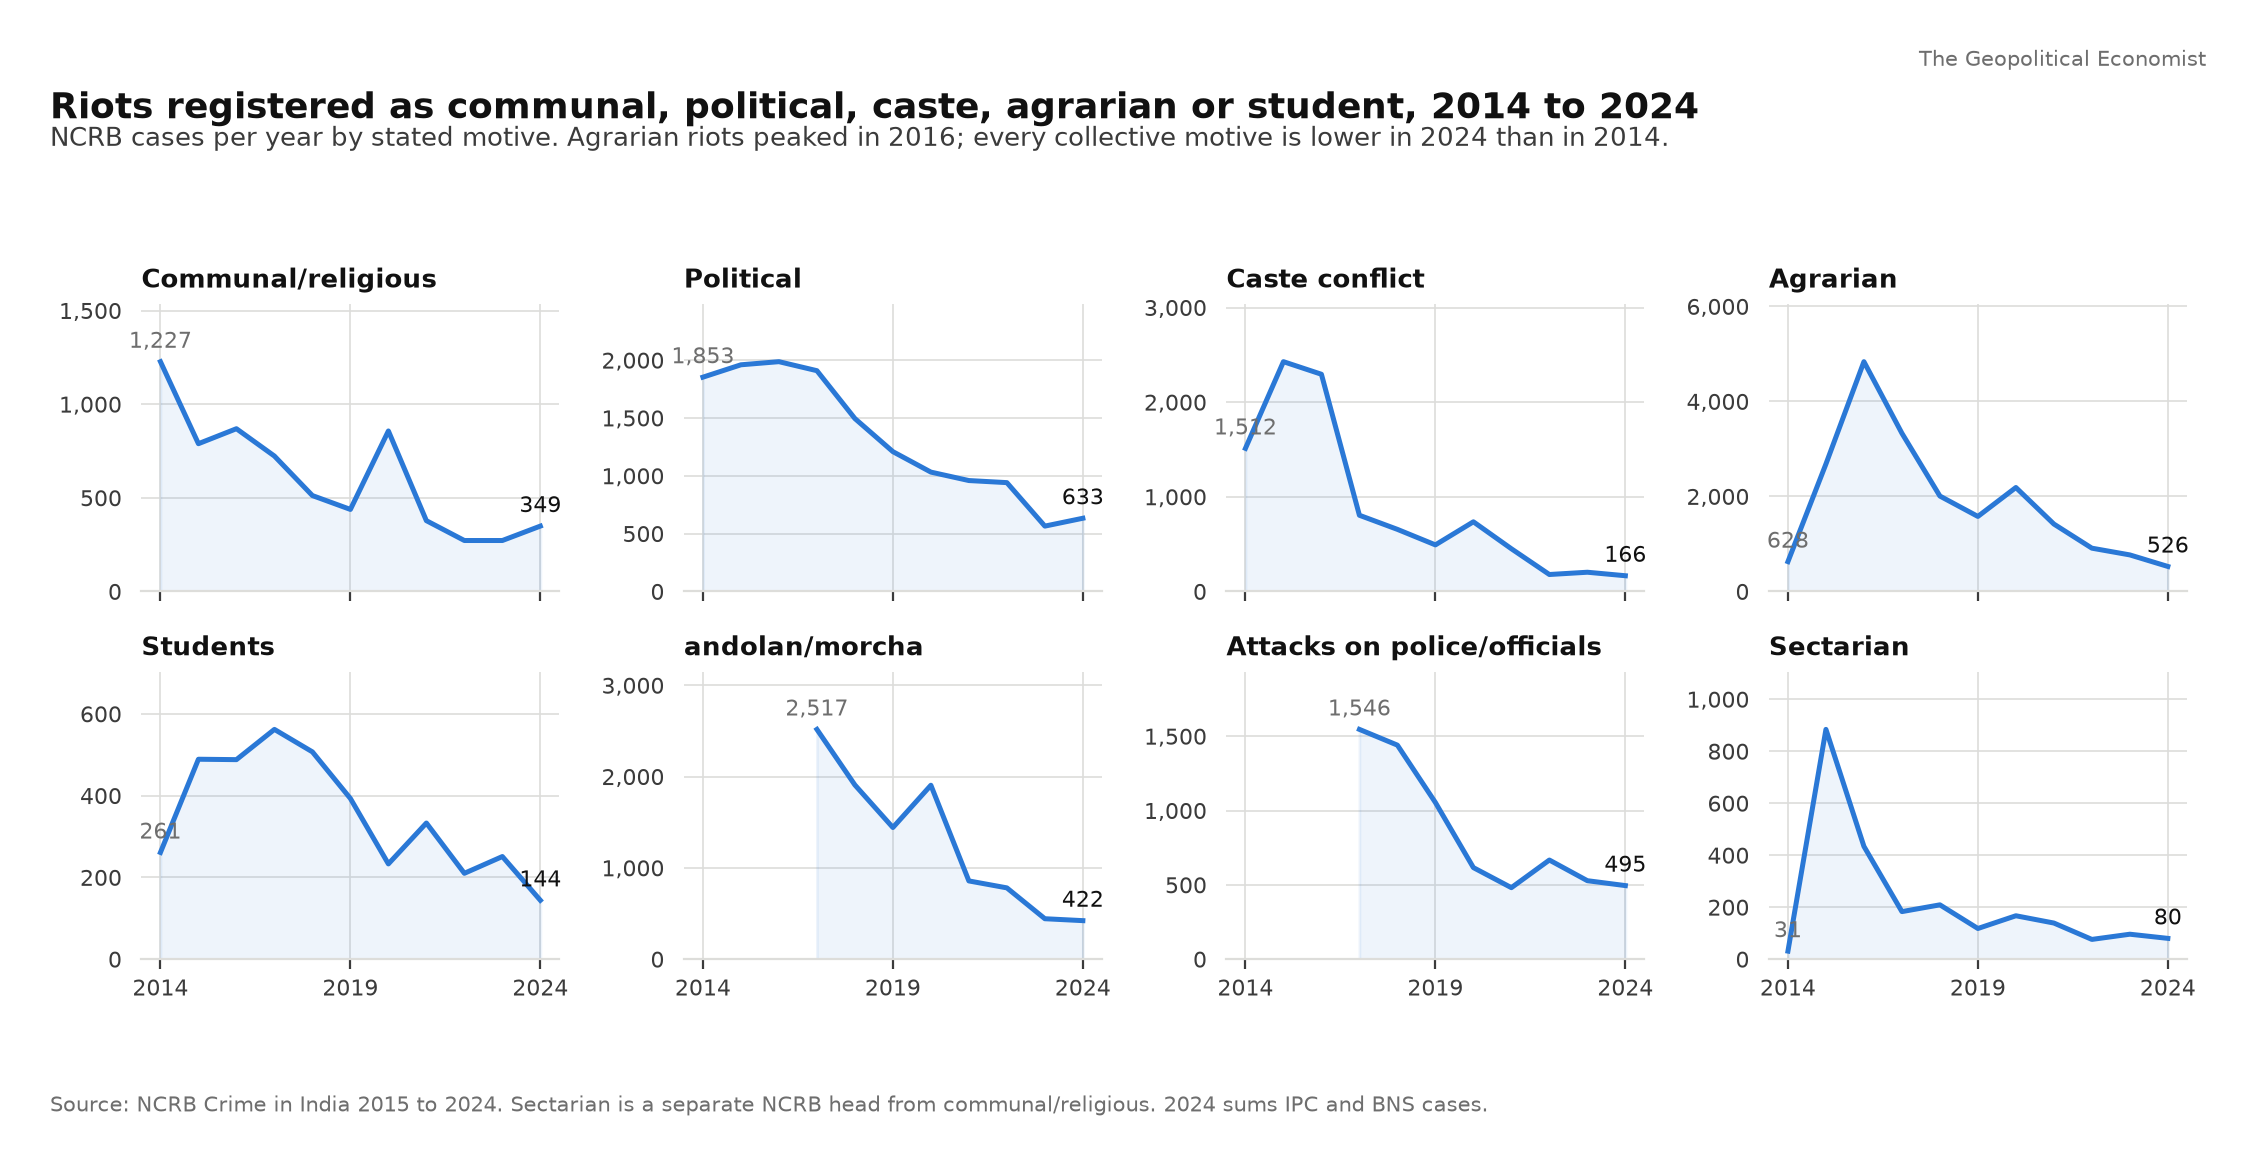
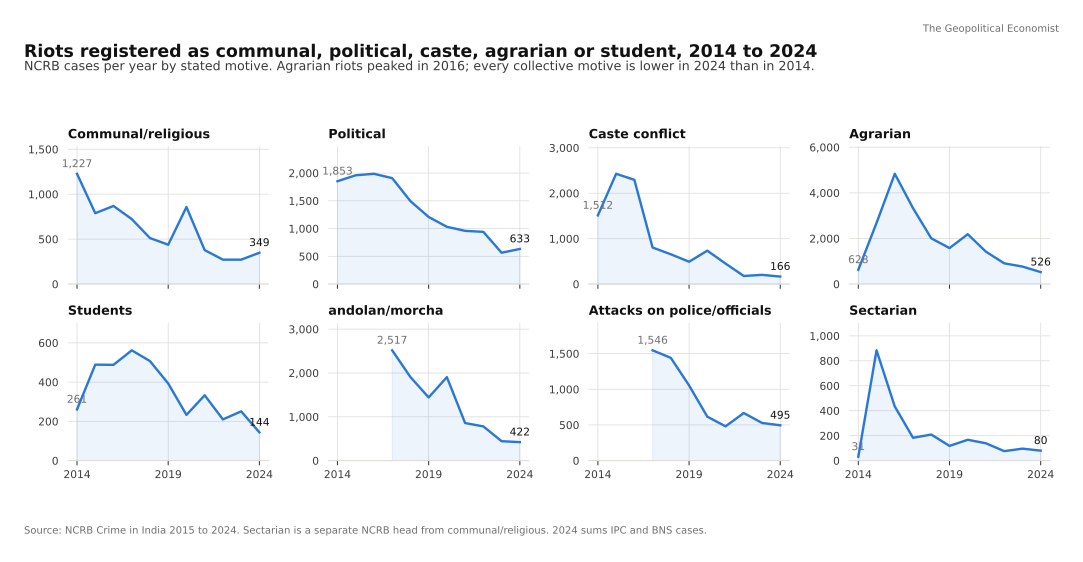
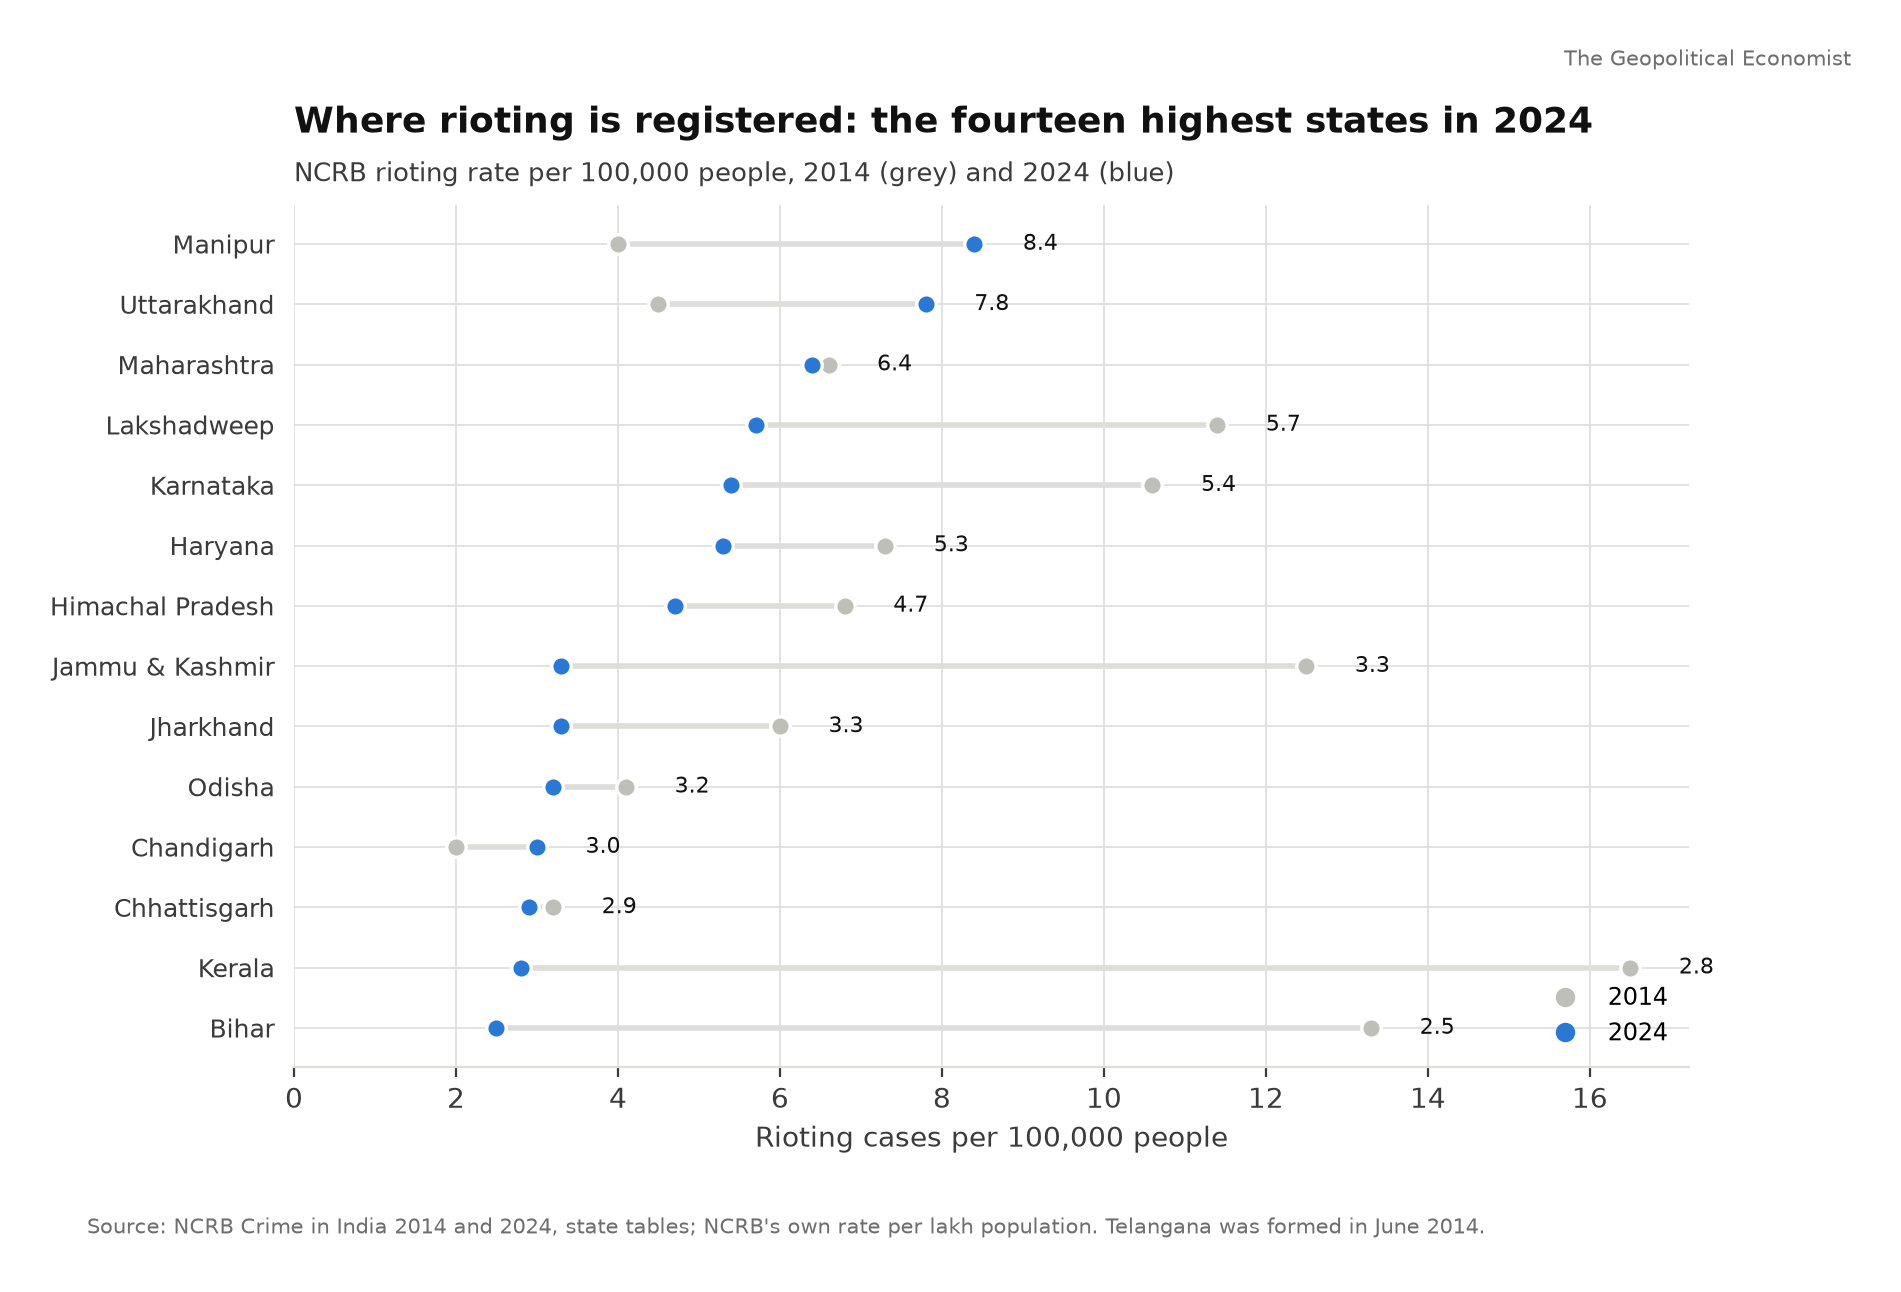
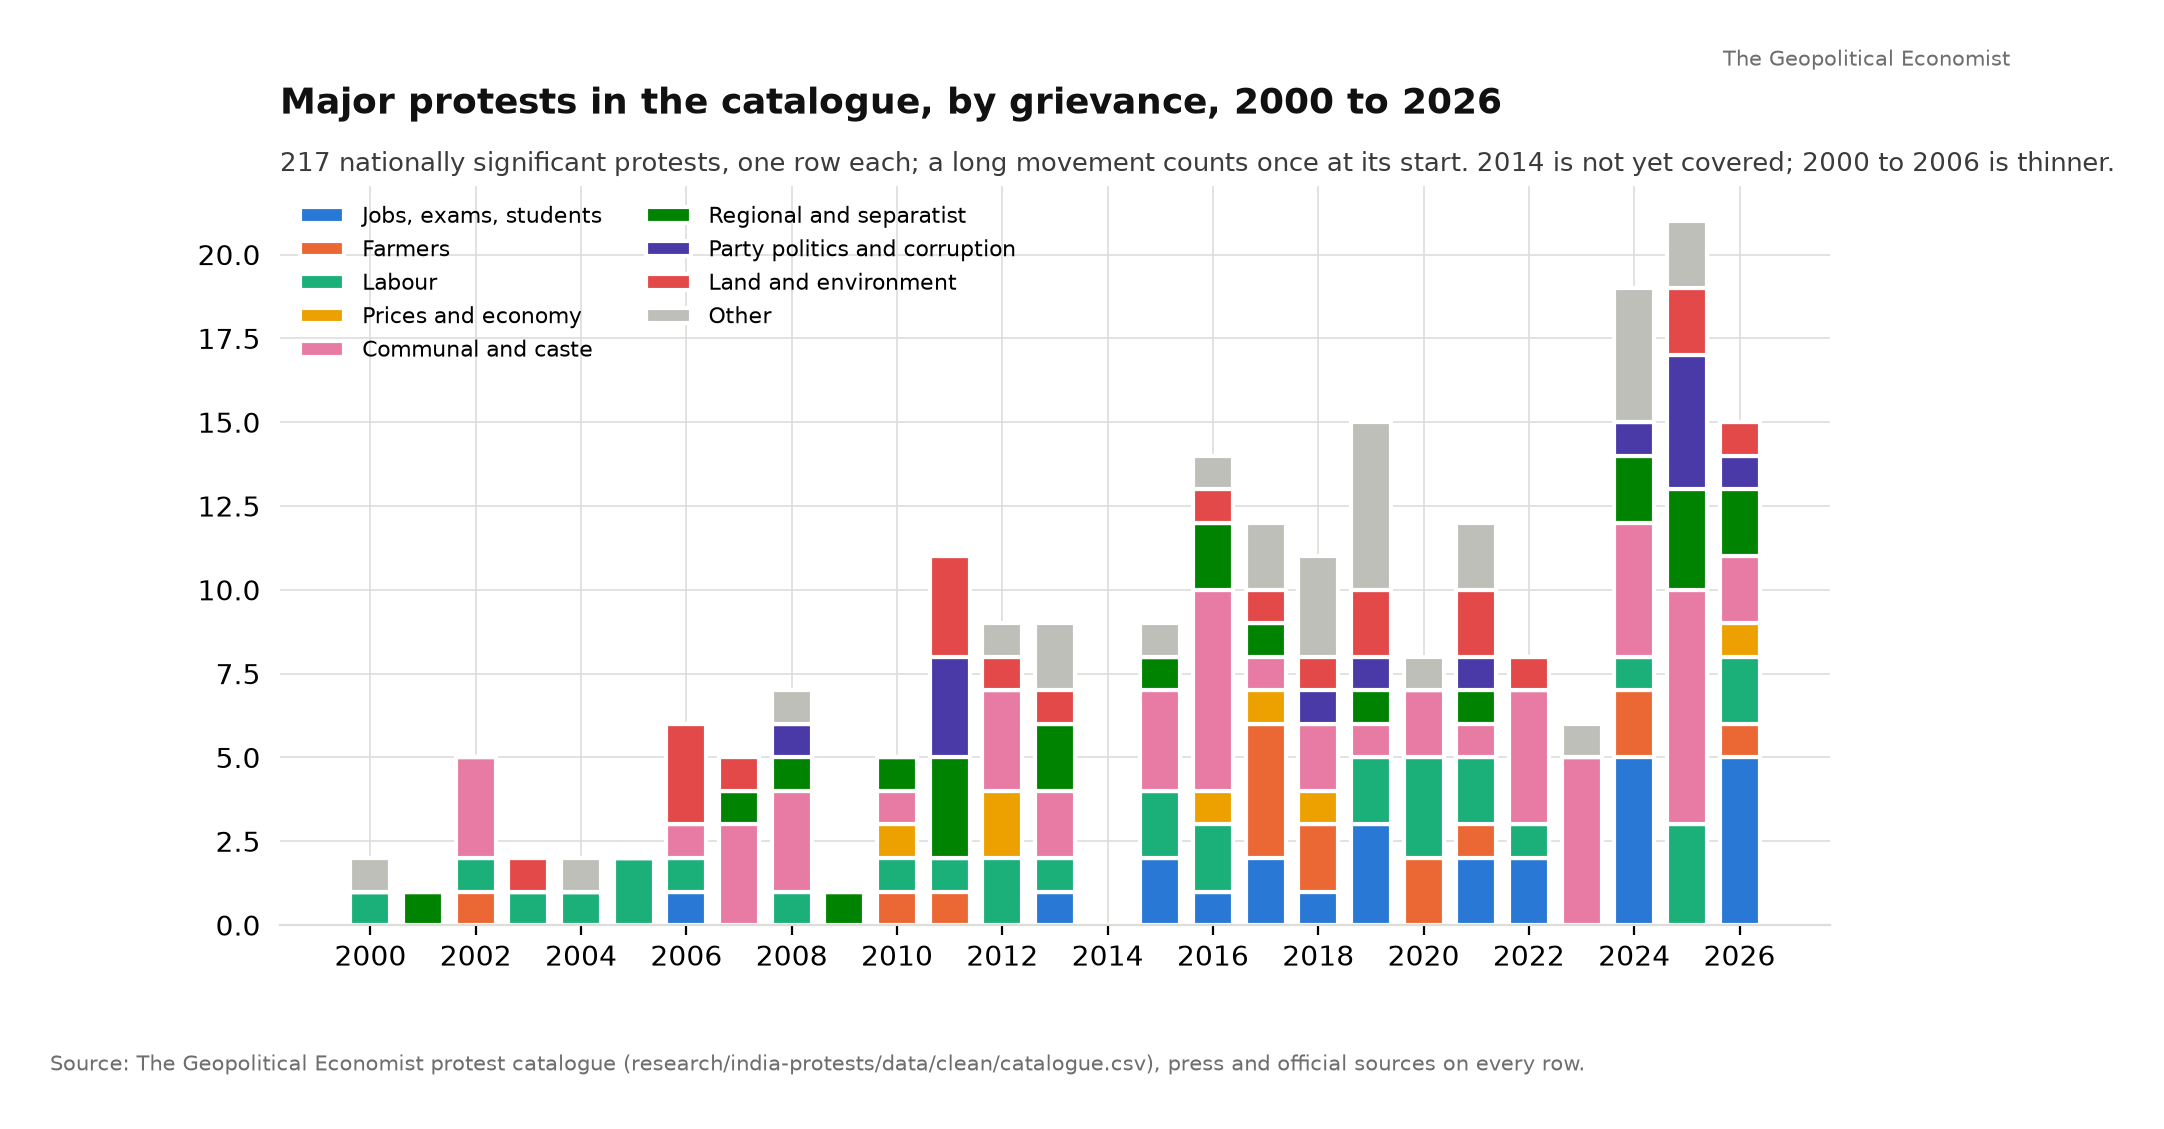
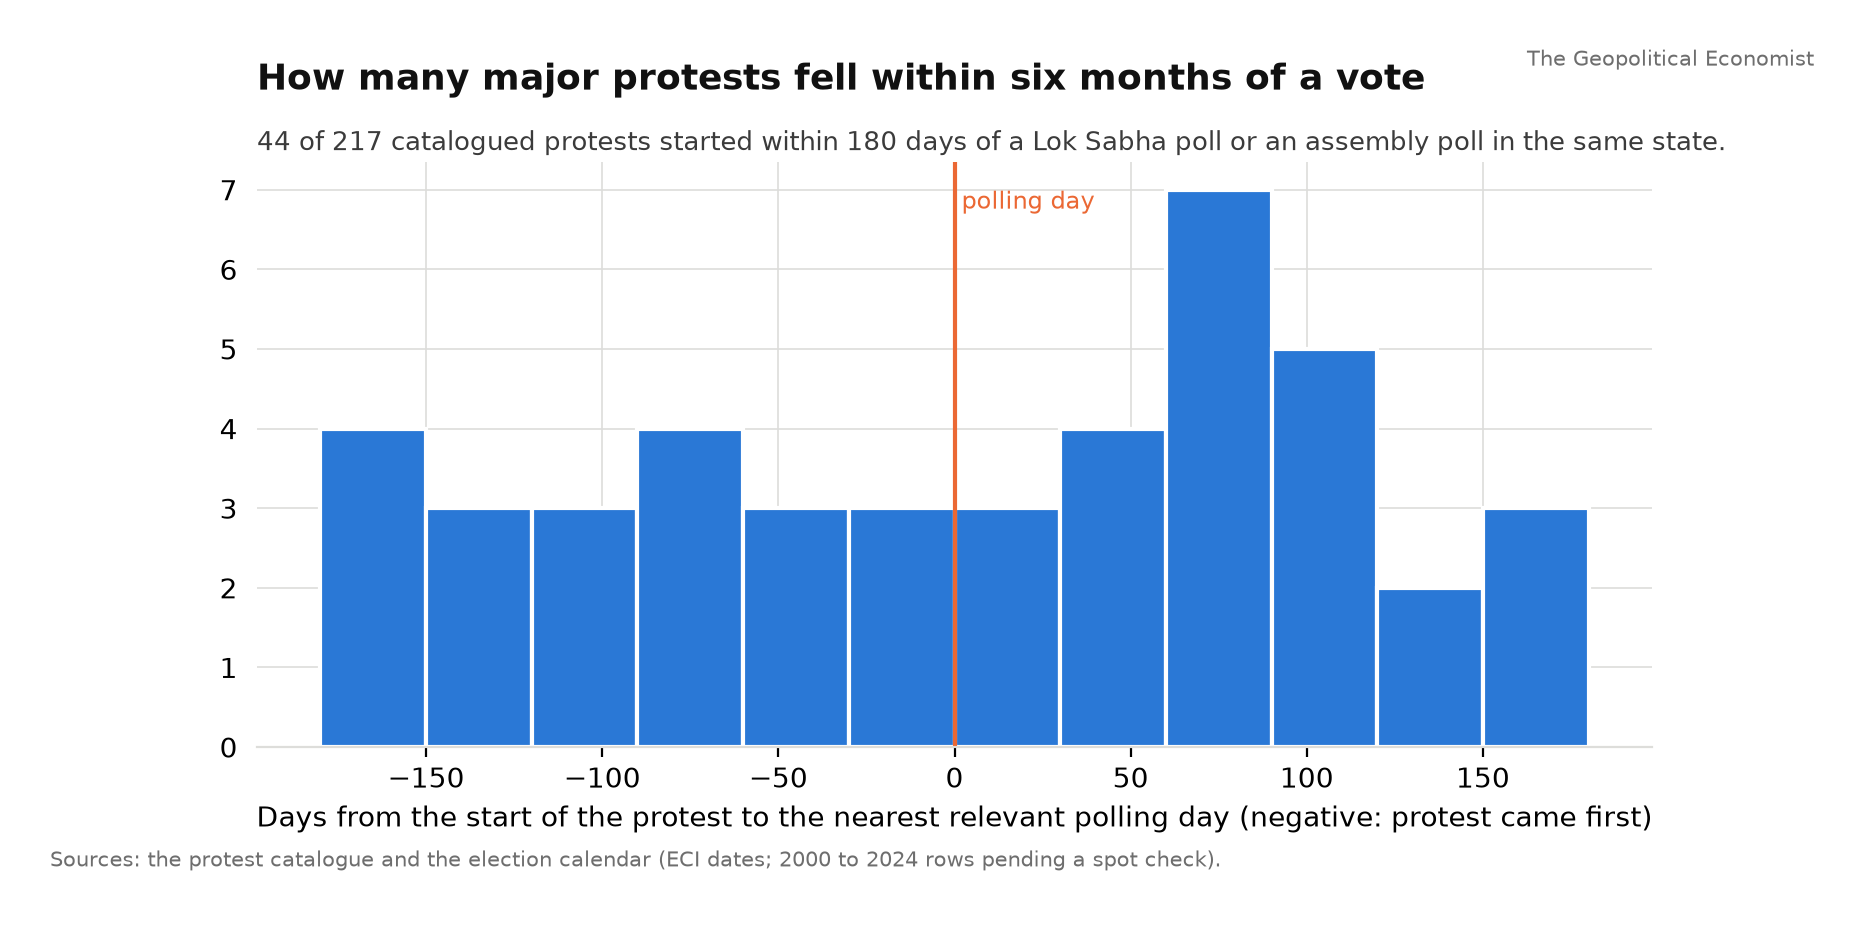
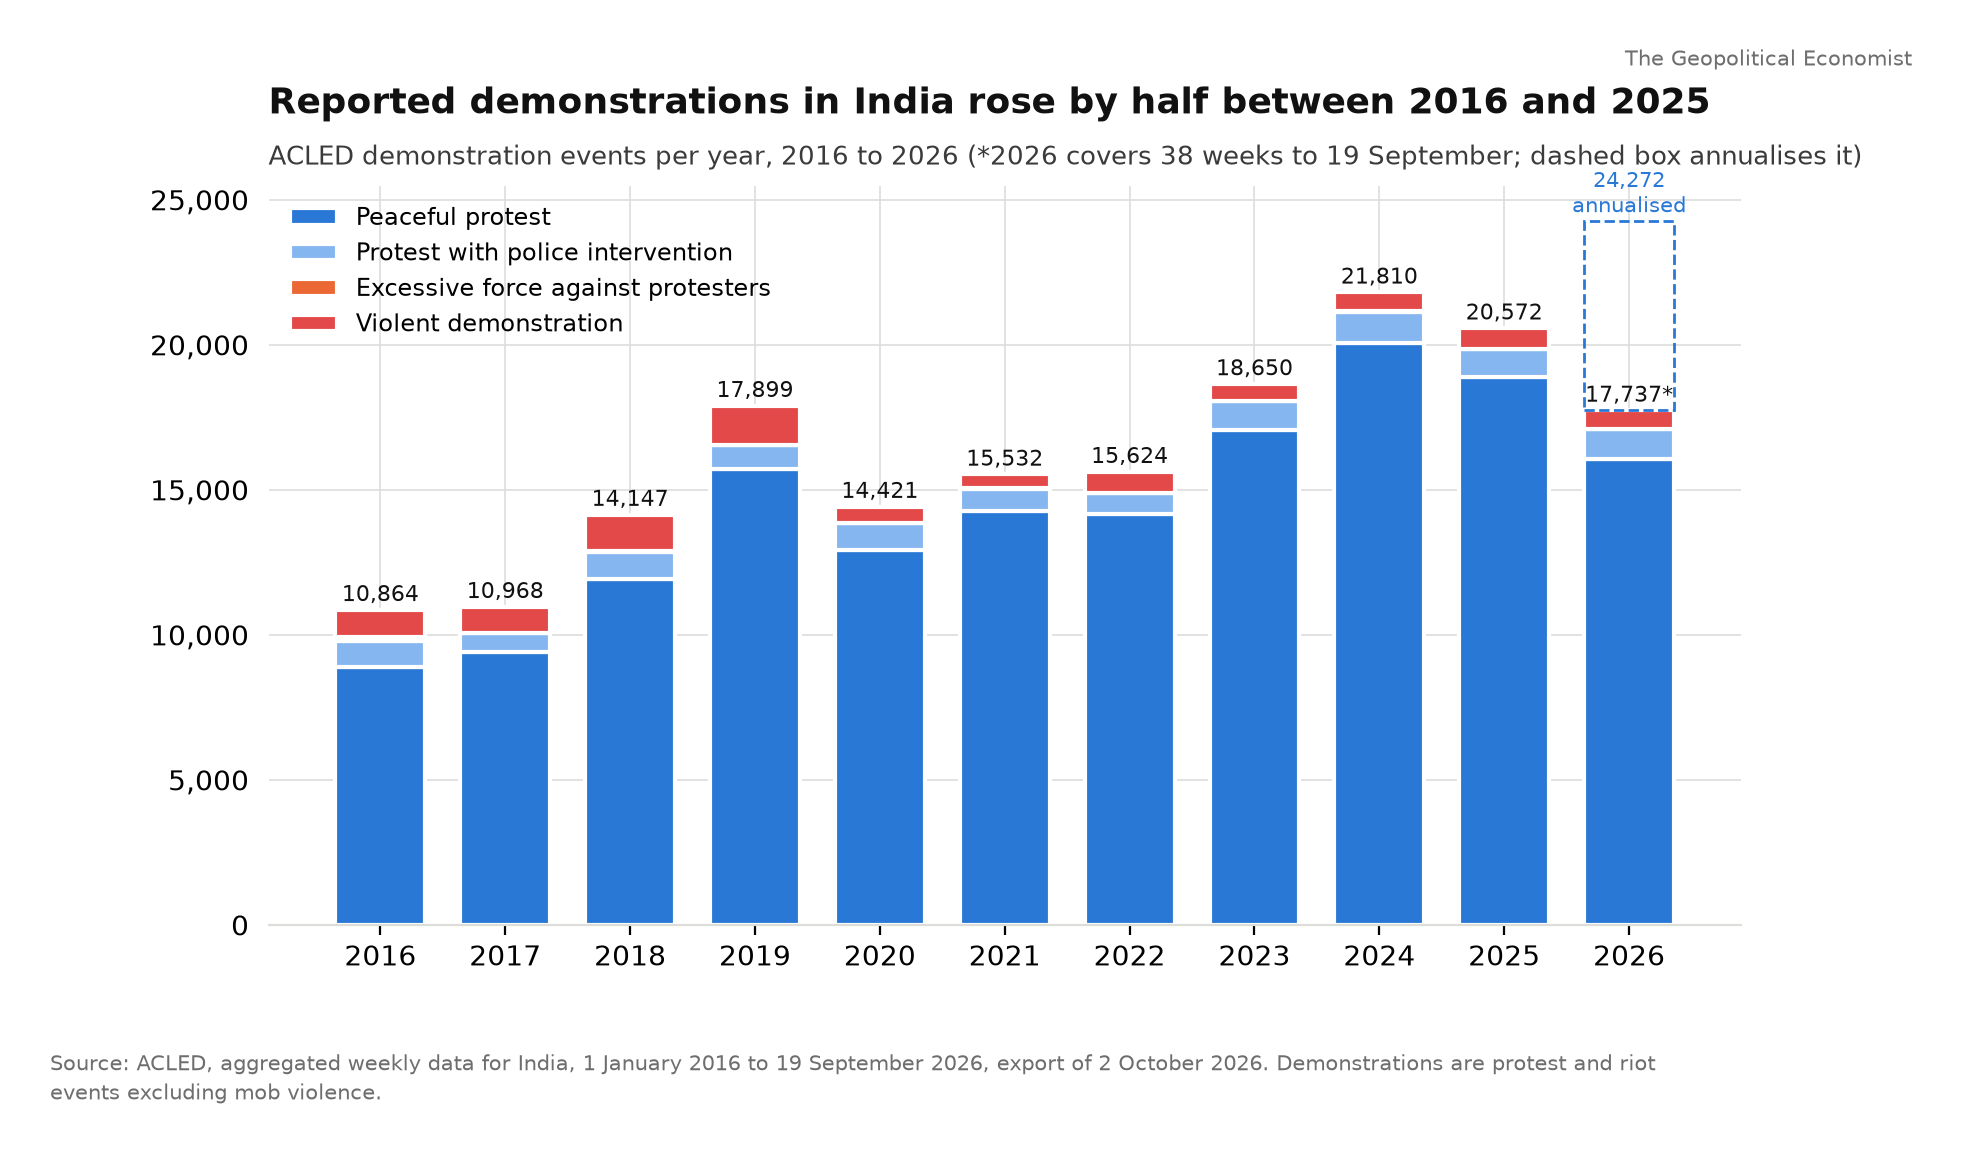
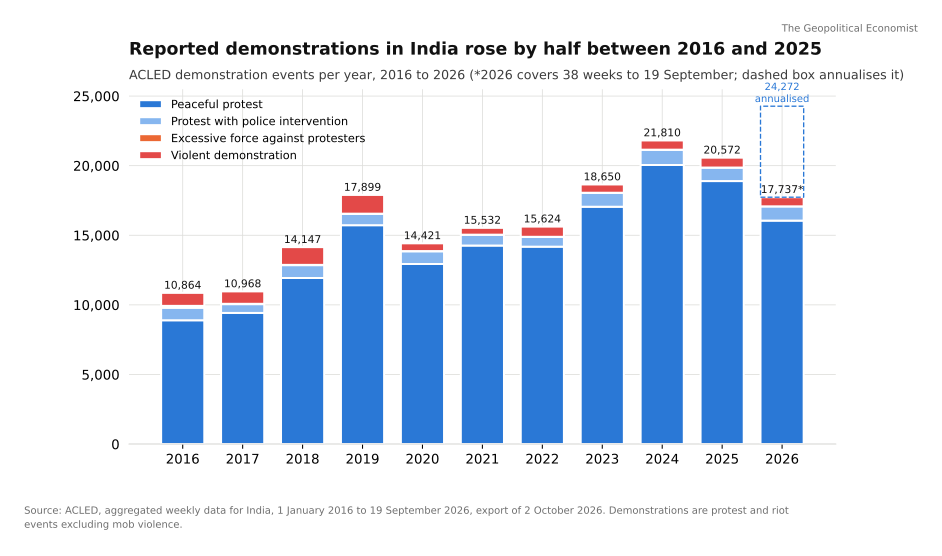
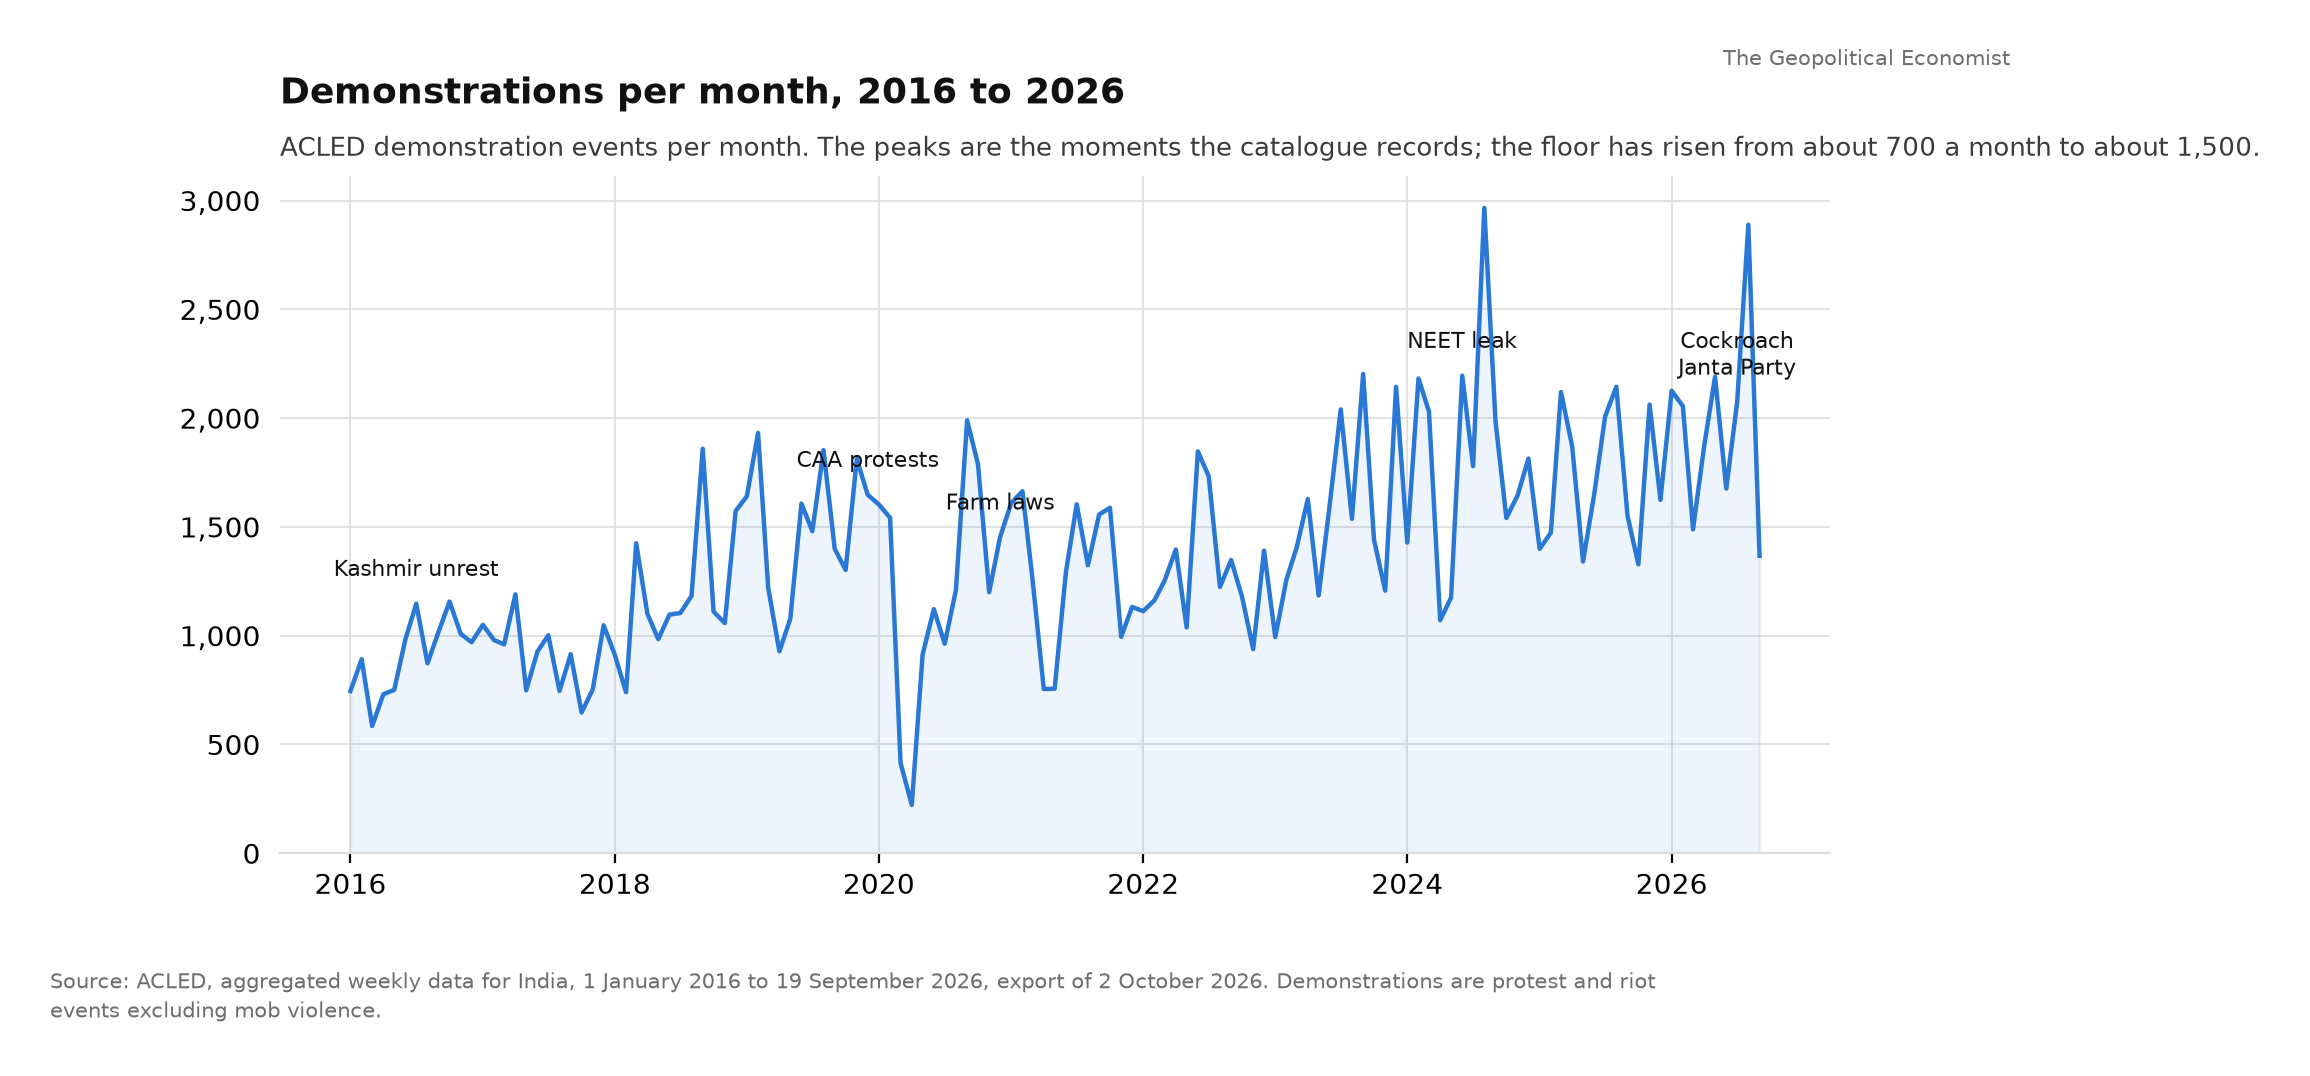
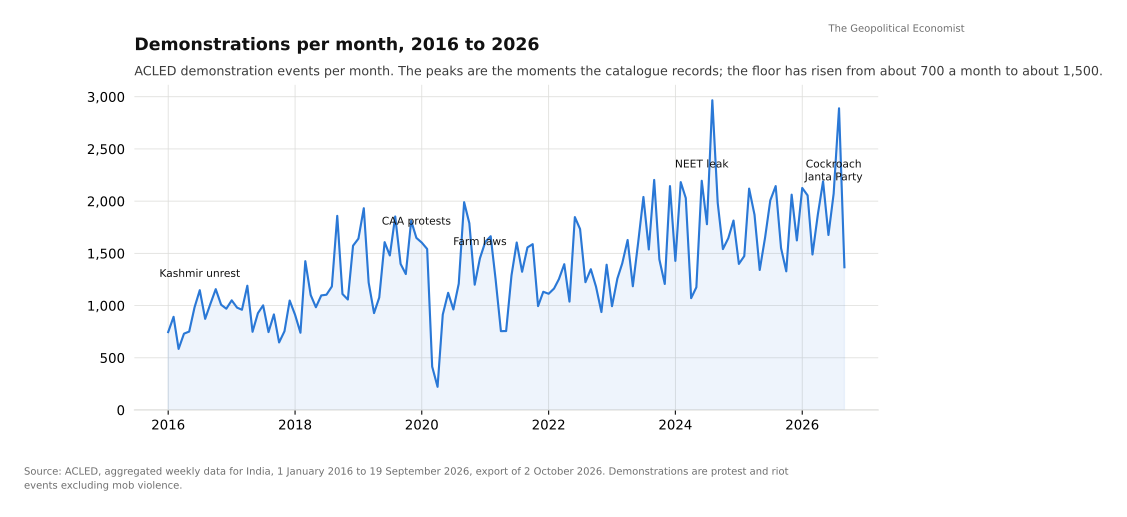
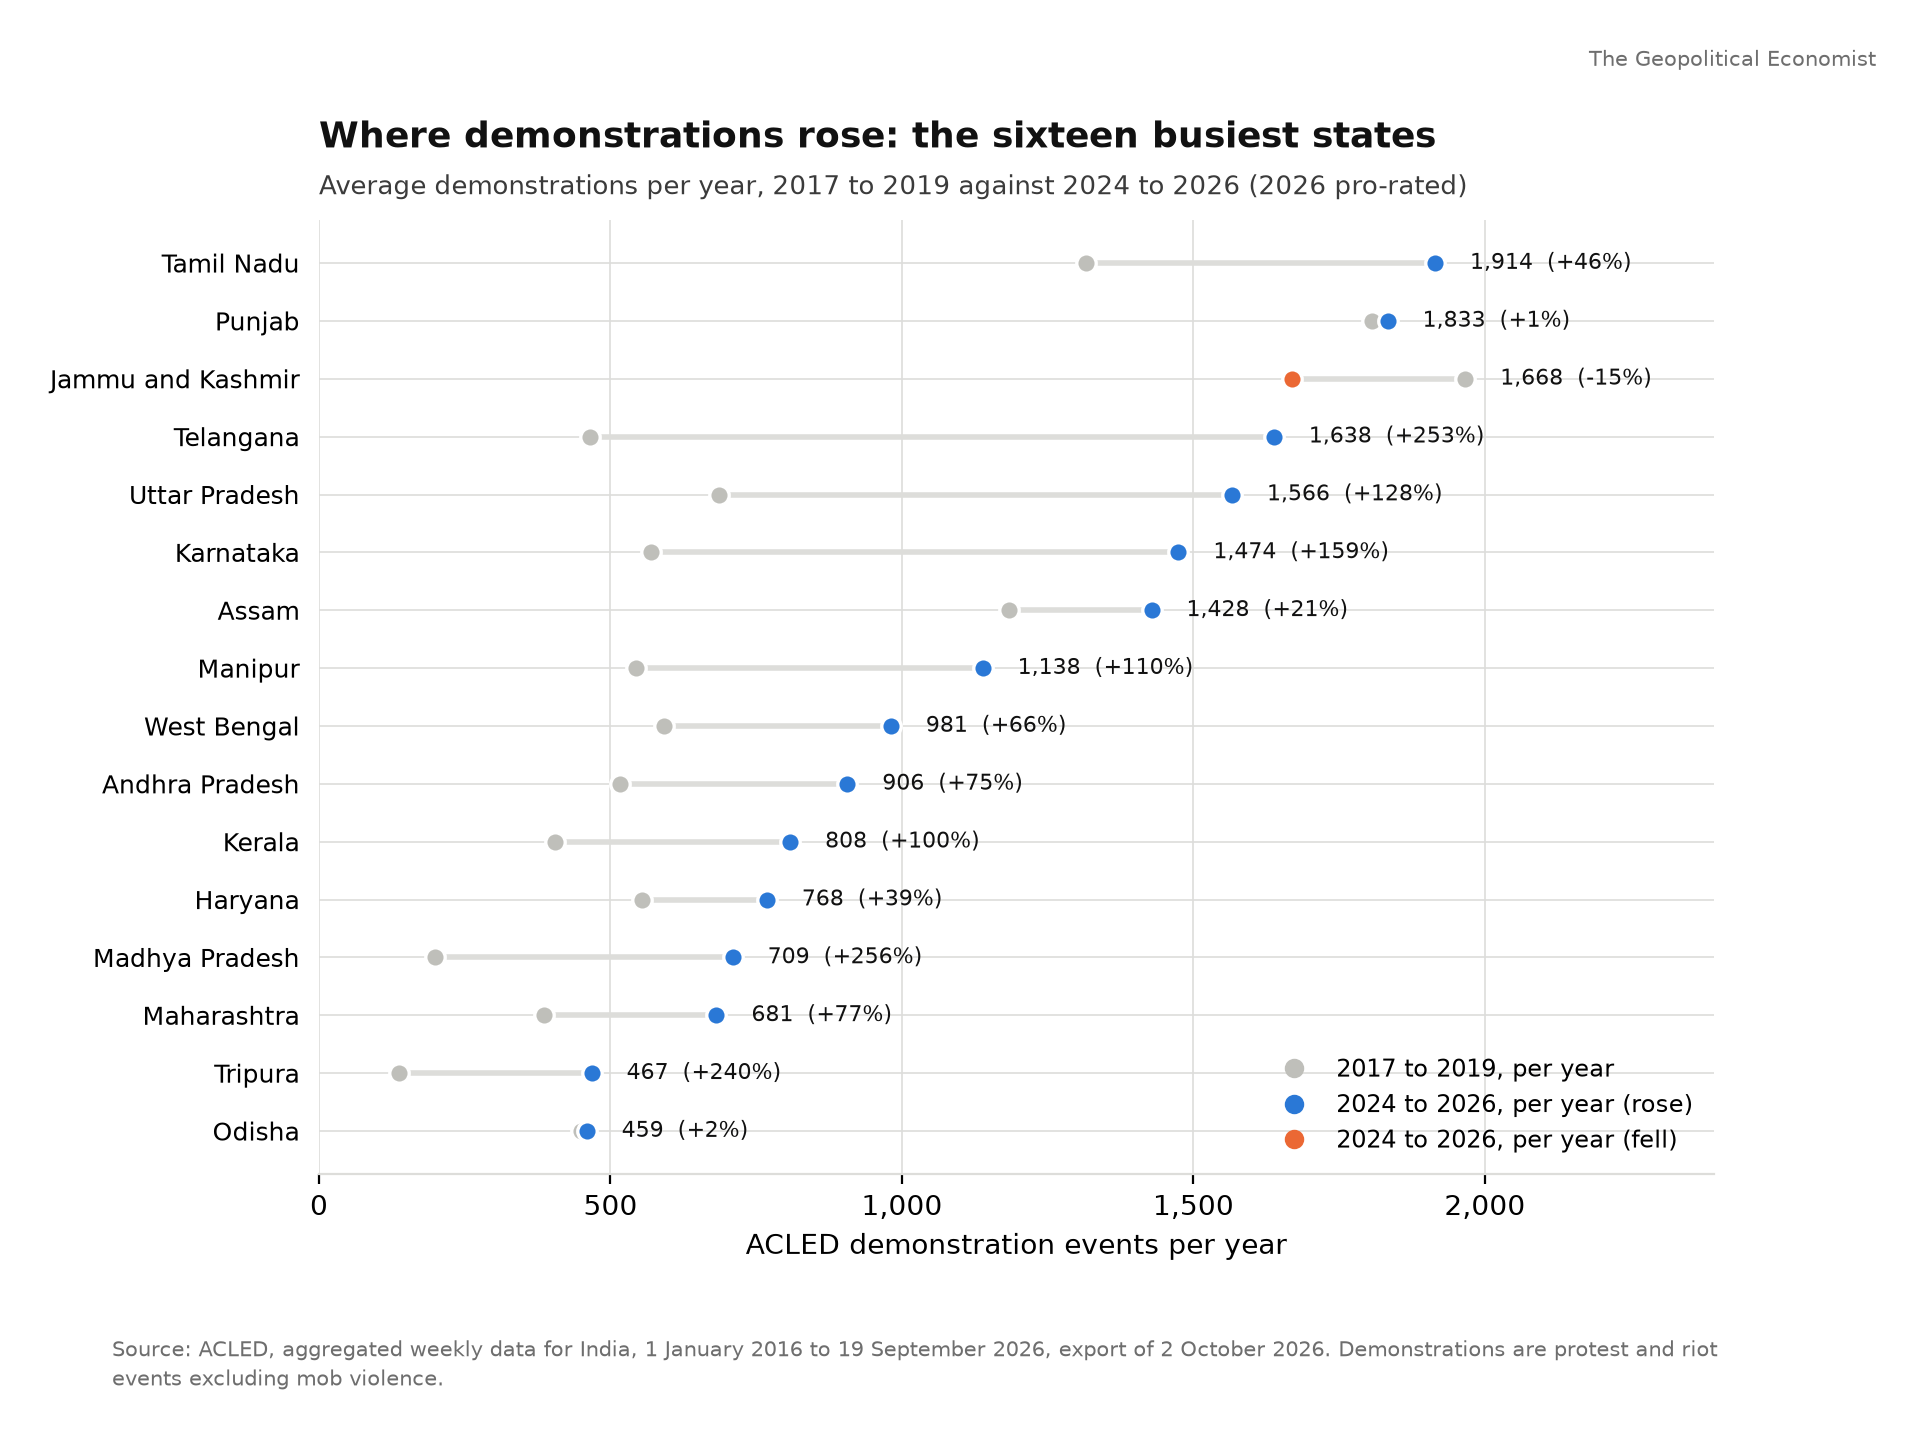
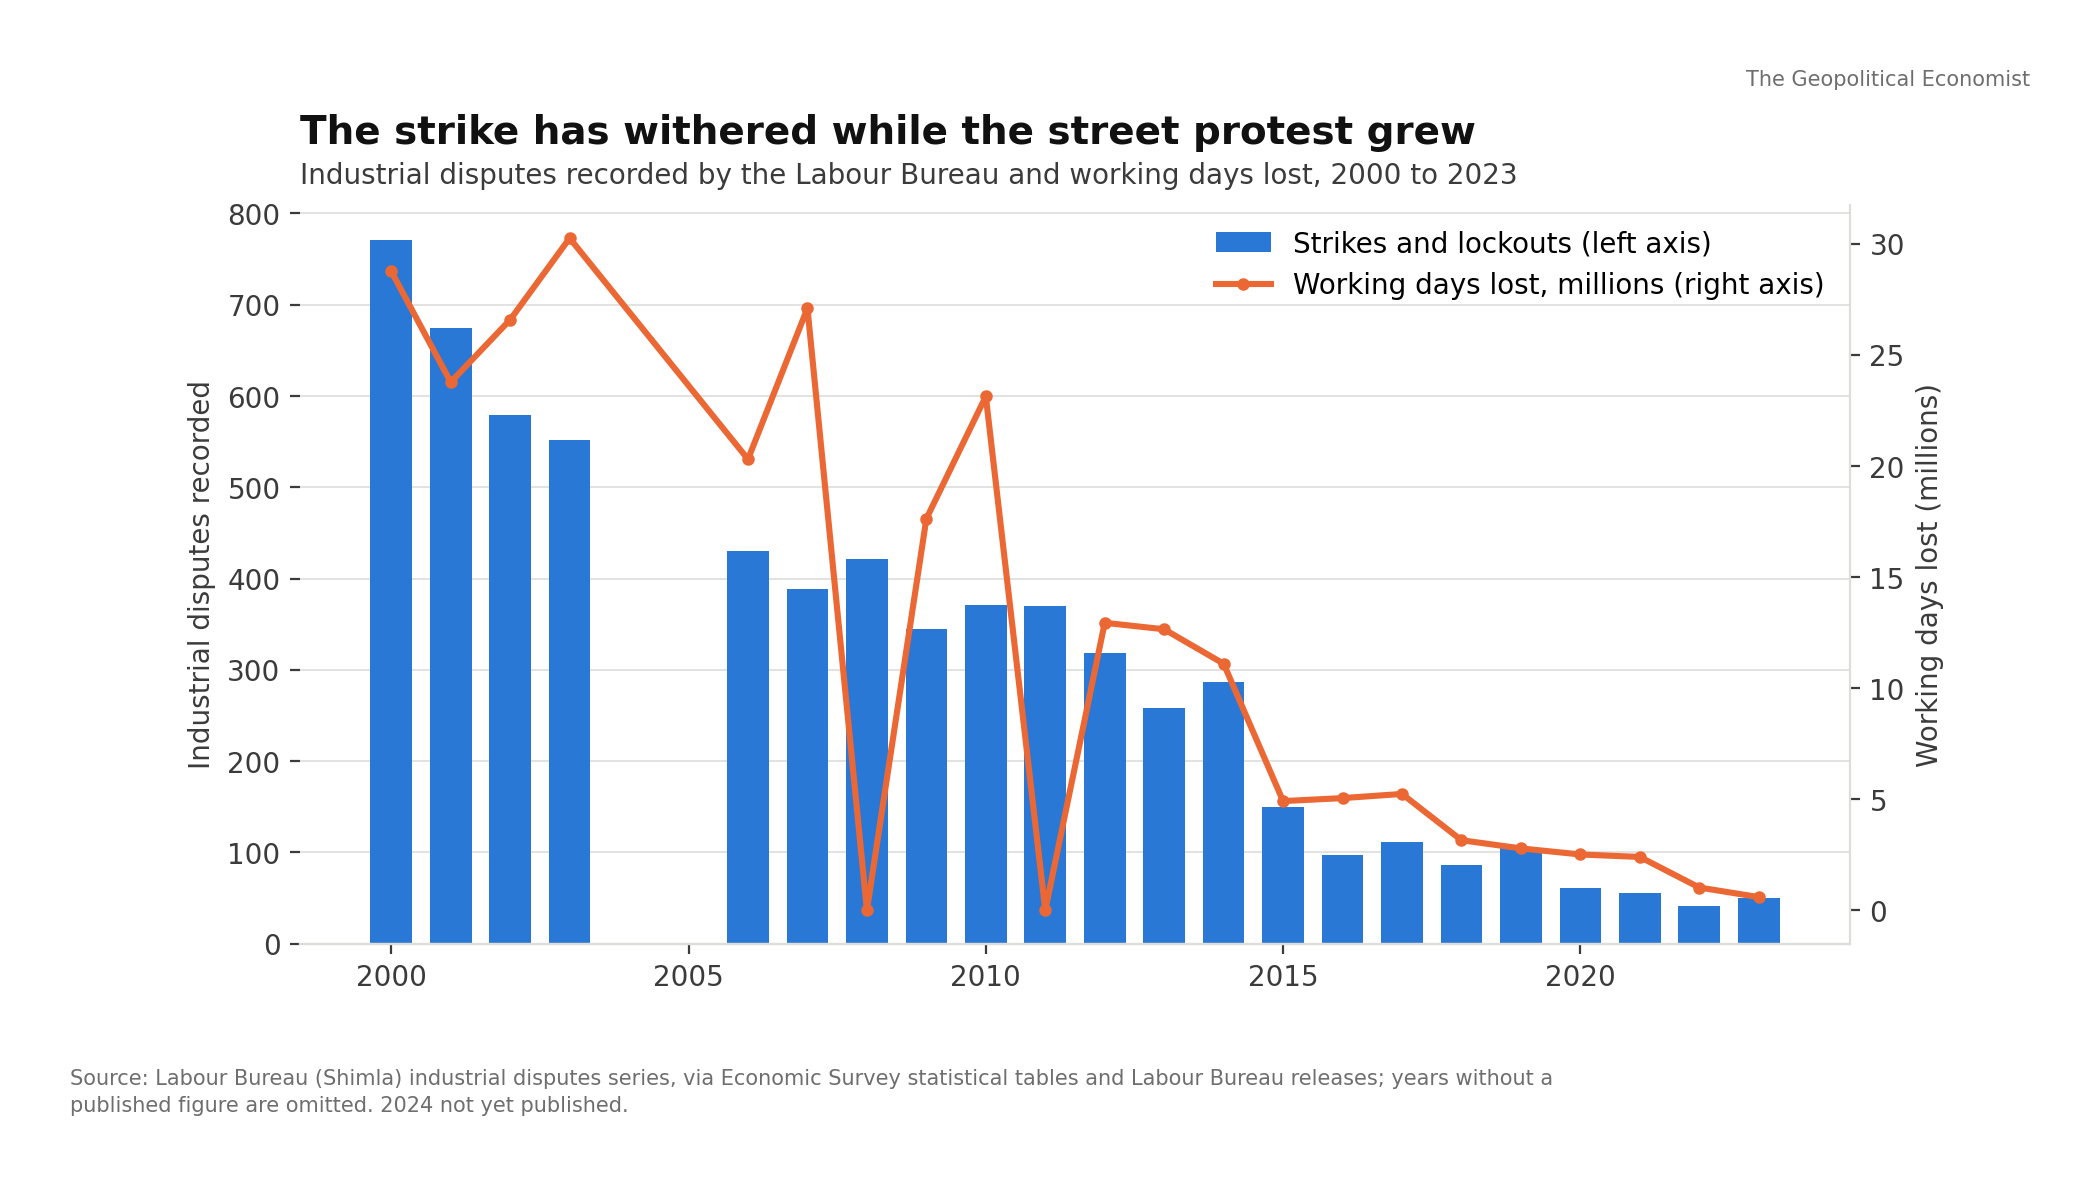
Every count of protests that exists for India points the same way. The ACLED event record shows demonstrations up by half since 2016 and at a record in 2024 to 2026. The police's own count of agitations was rising before that. A catalogue of 217 major protests since 2000 shows the rate doubling since the late 2010s. The protests are also more peaceful than a decade ago. What has fallen is rioting, which is a different thing.
- Part 2What Indians Are Protesting About. It Isn't Prices.
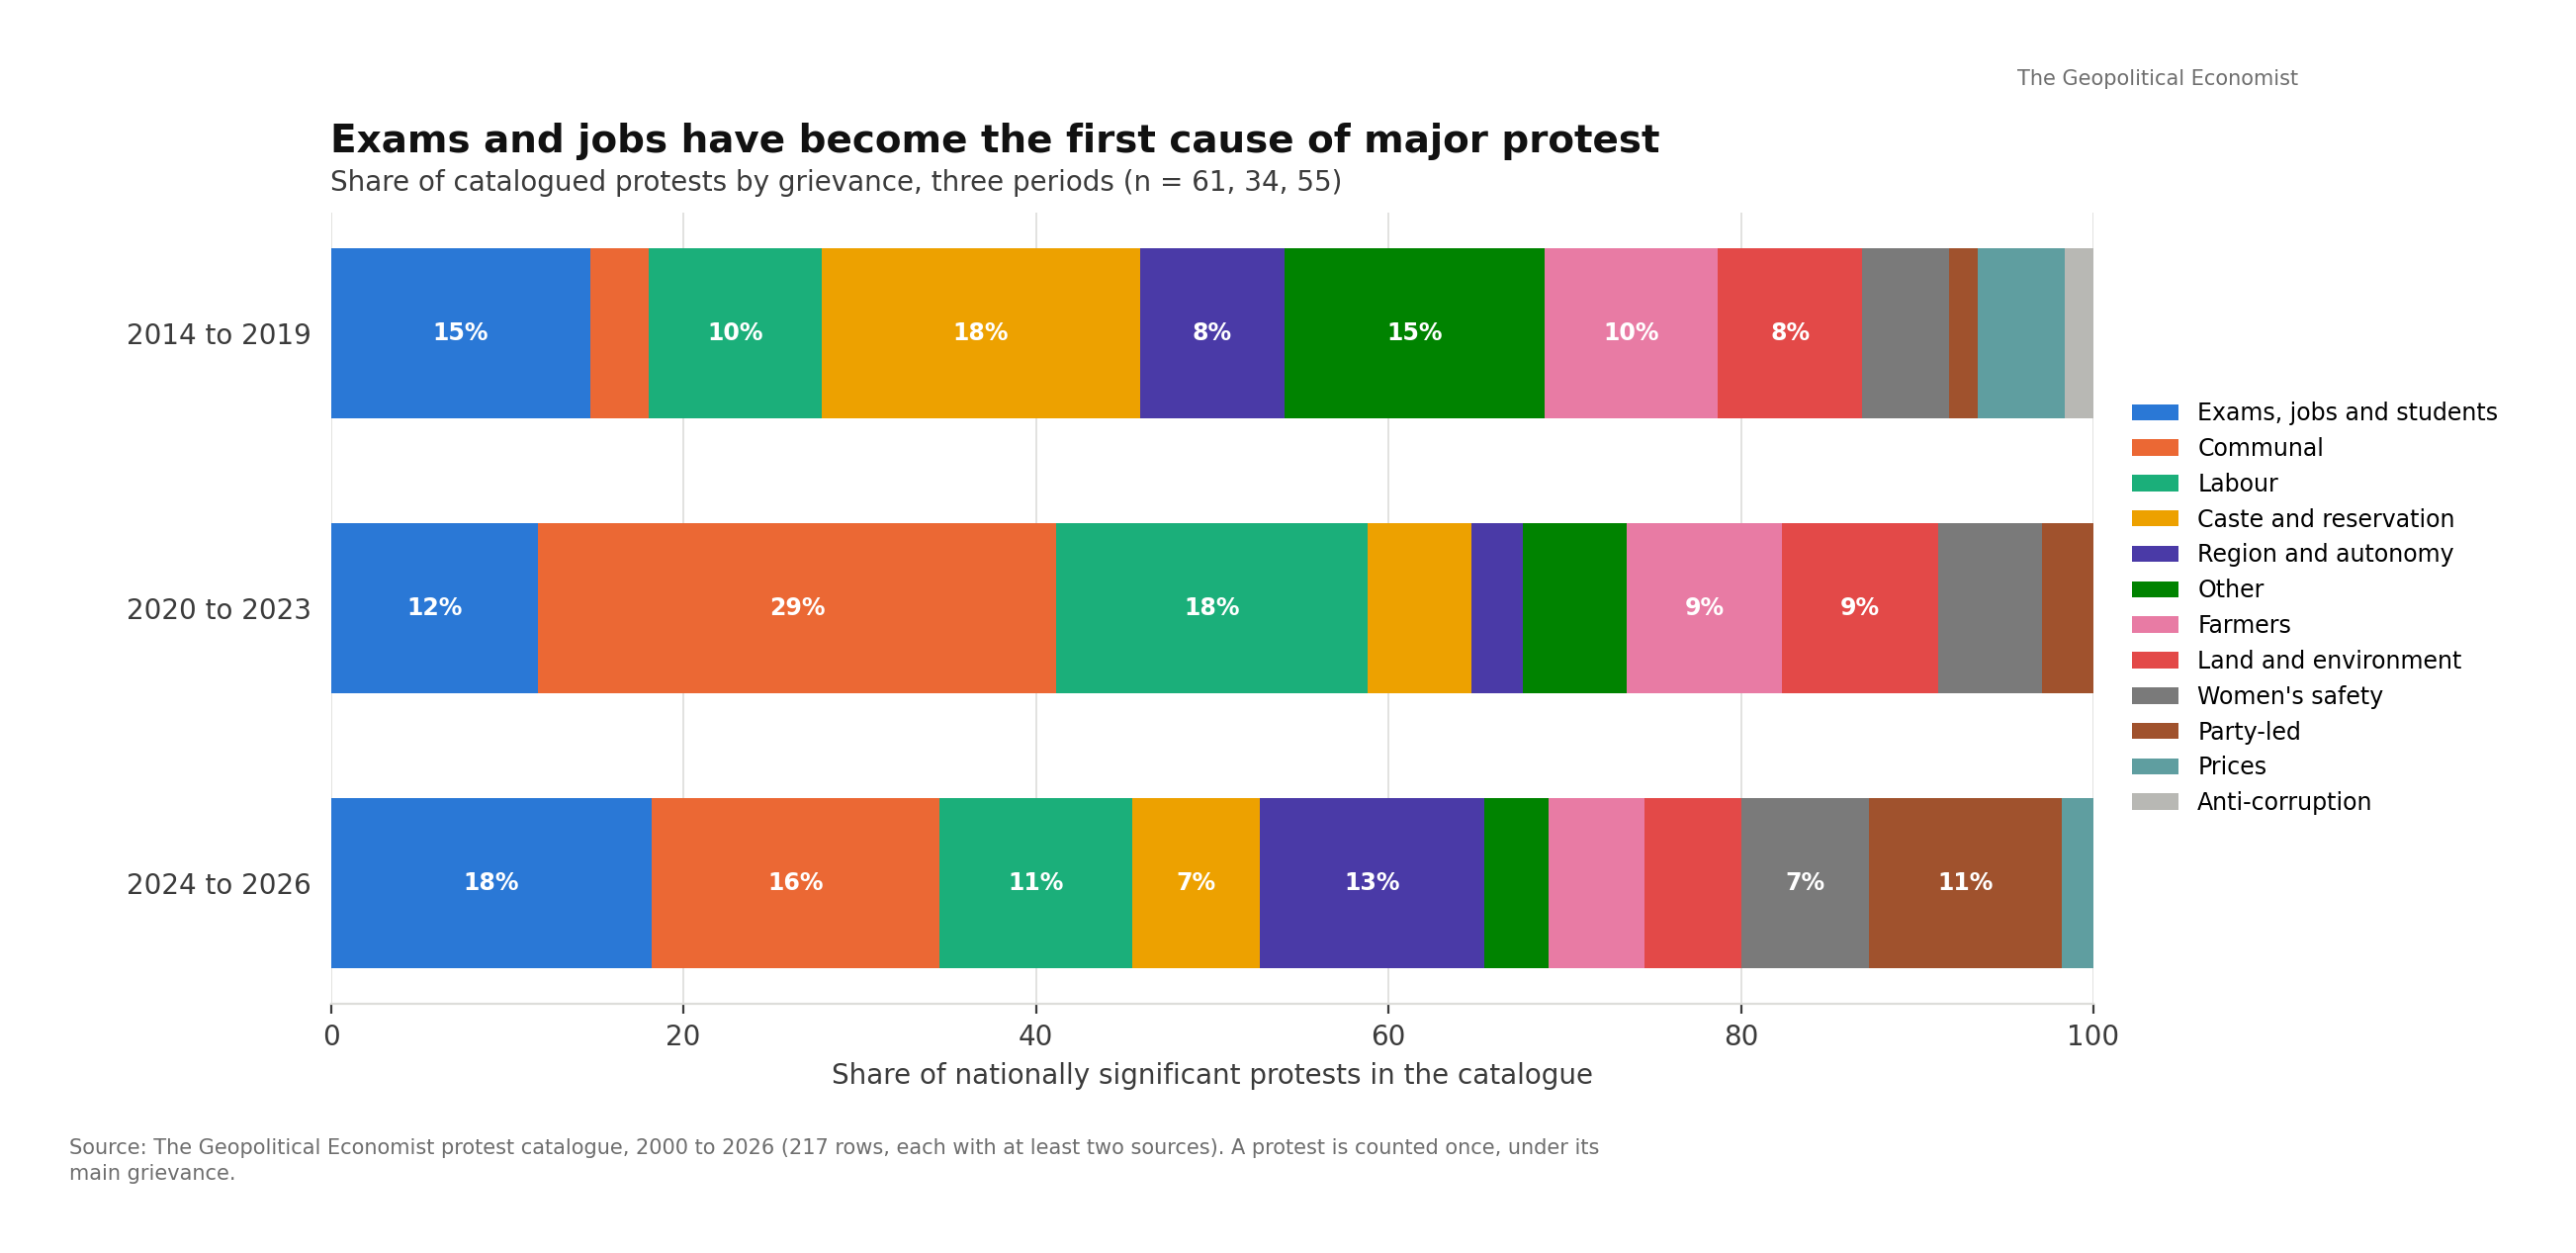
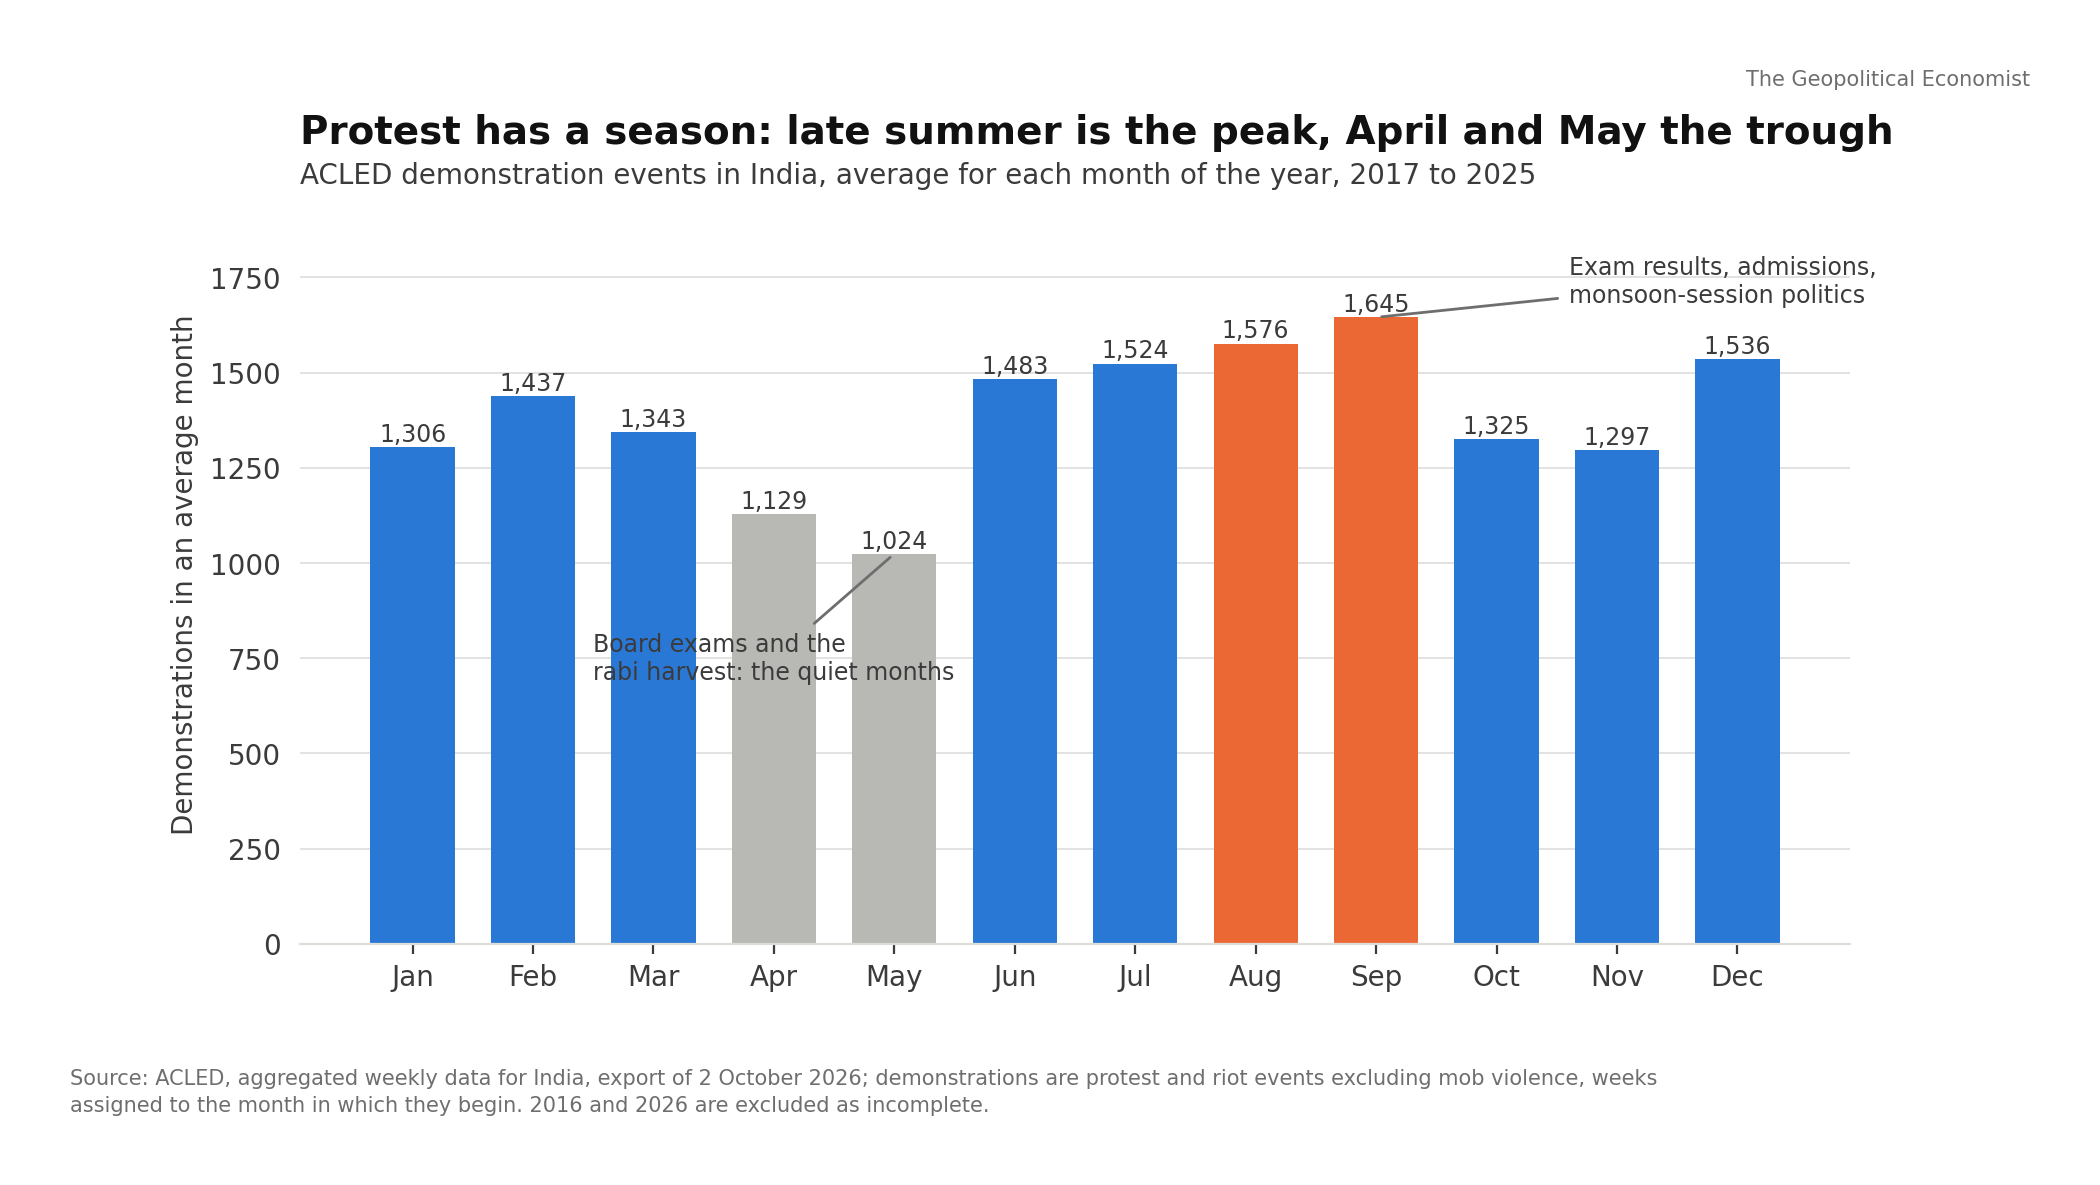
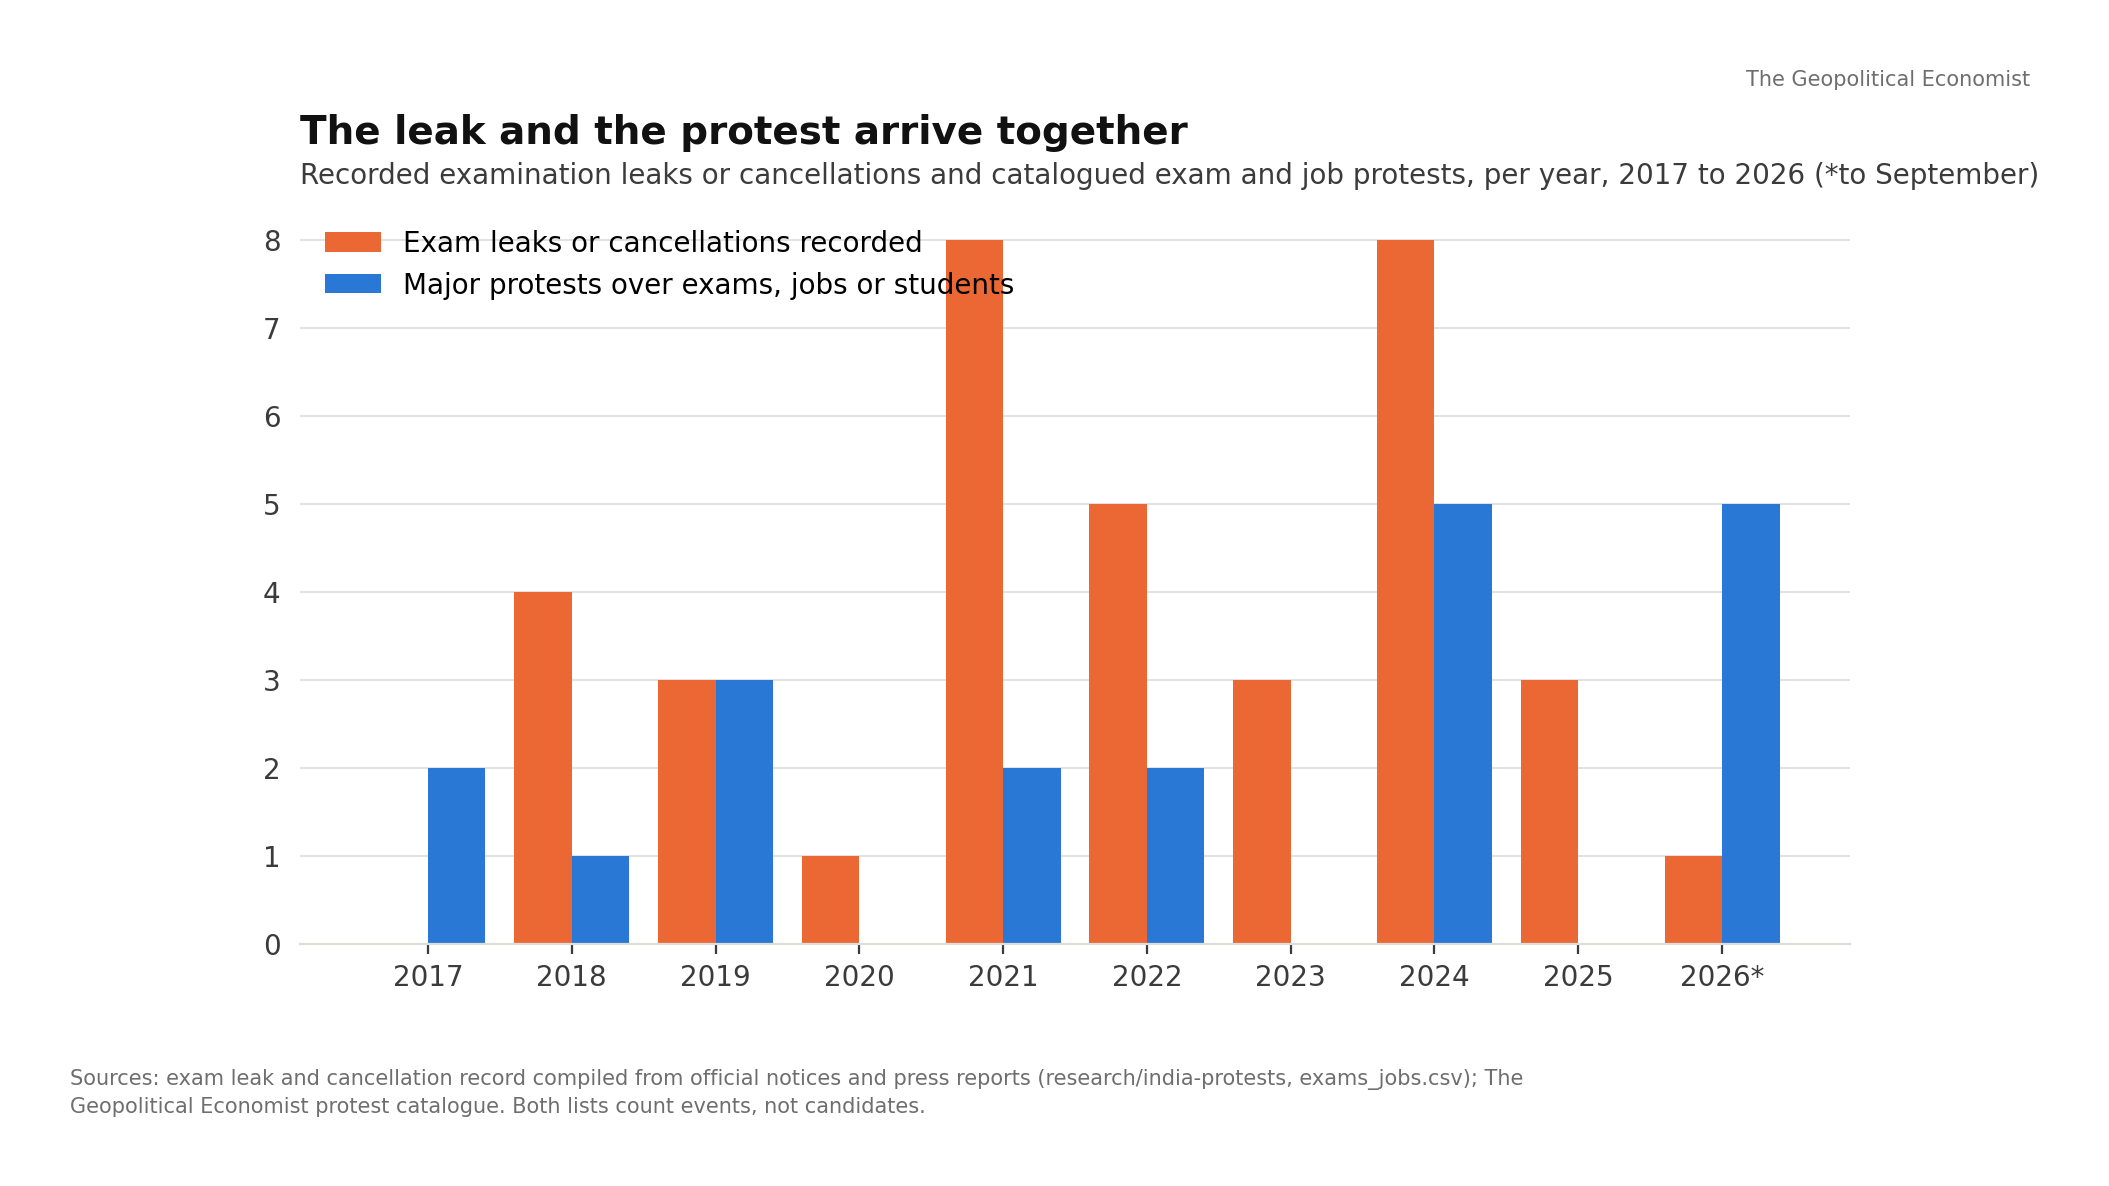
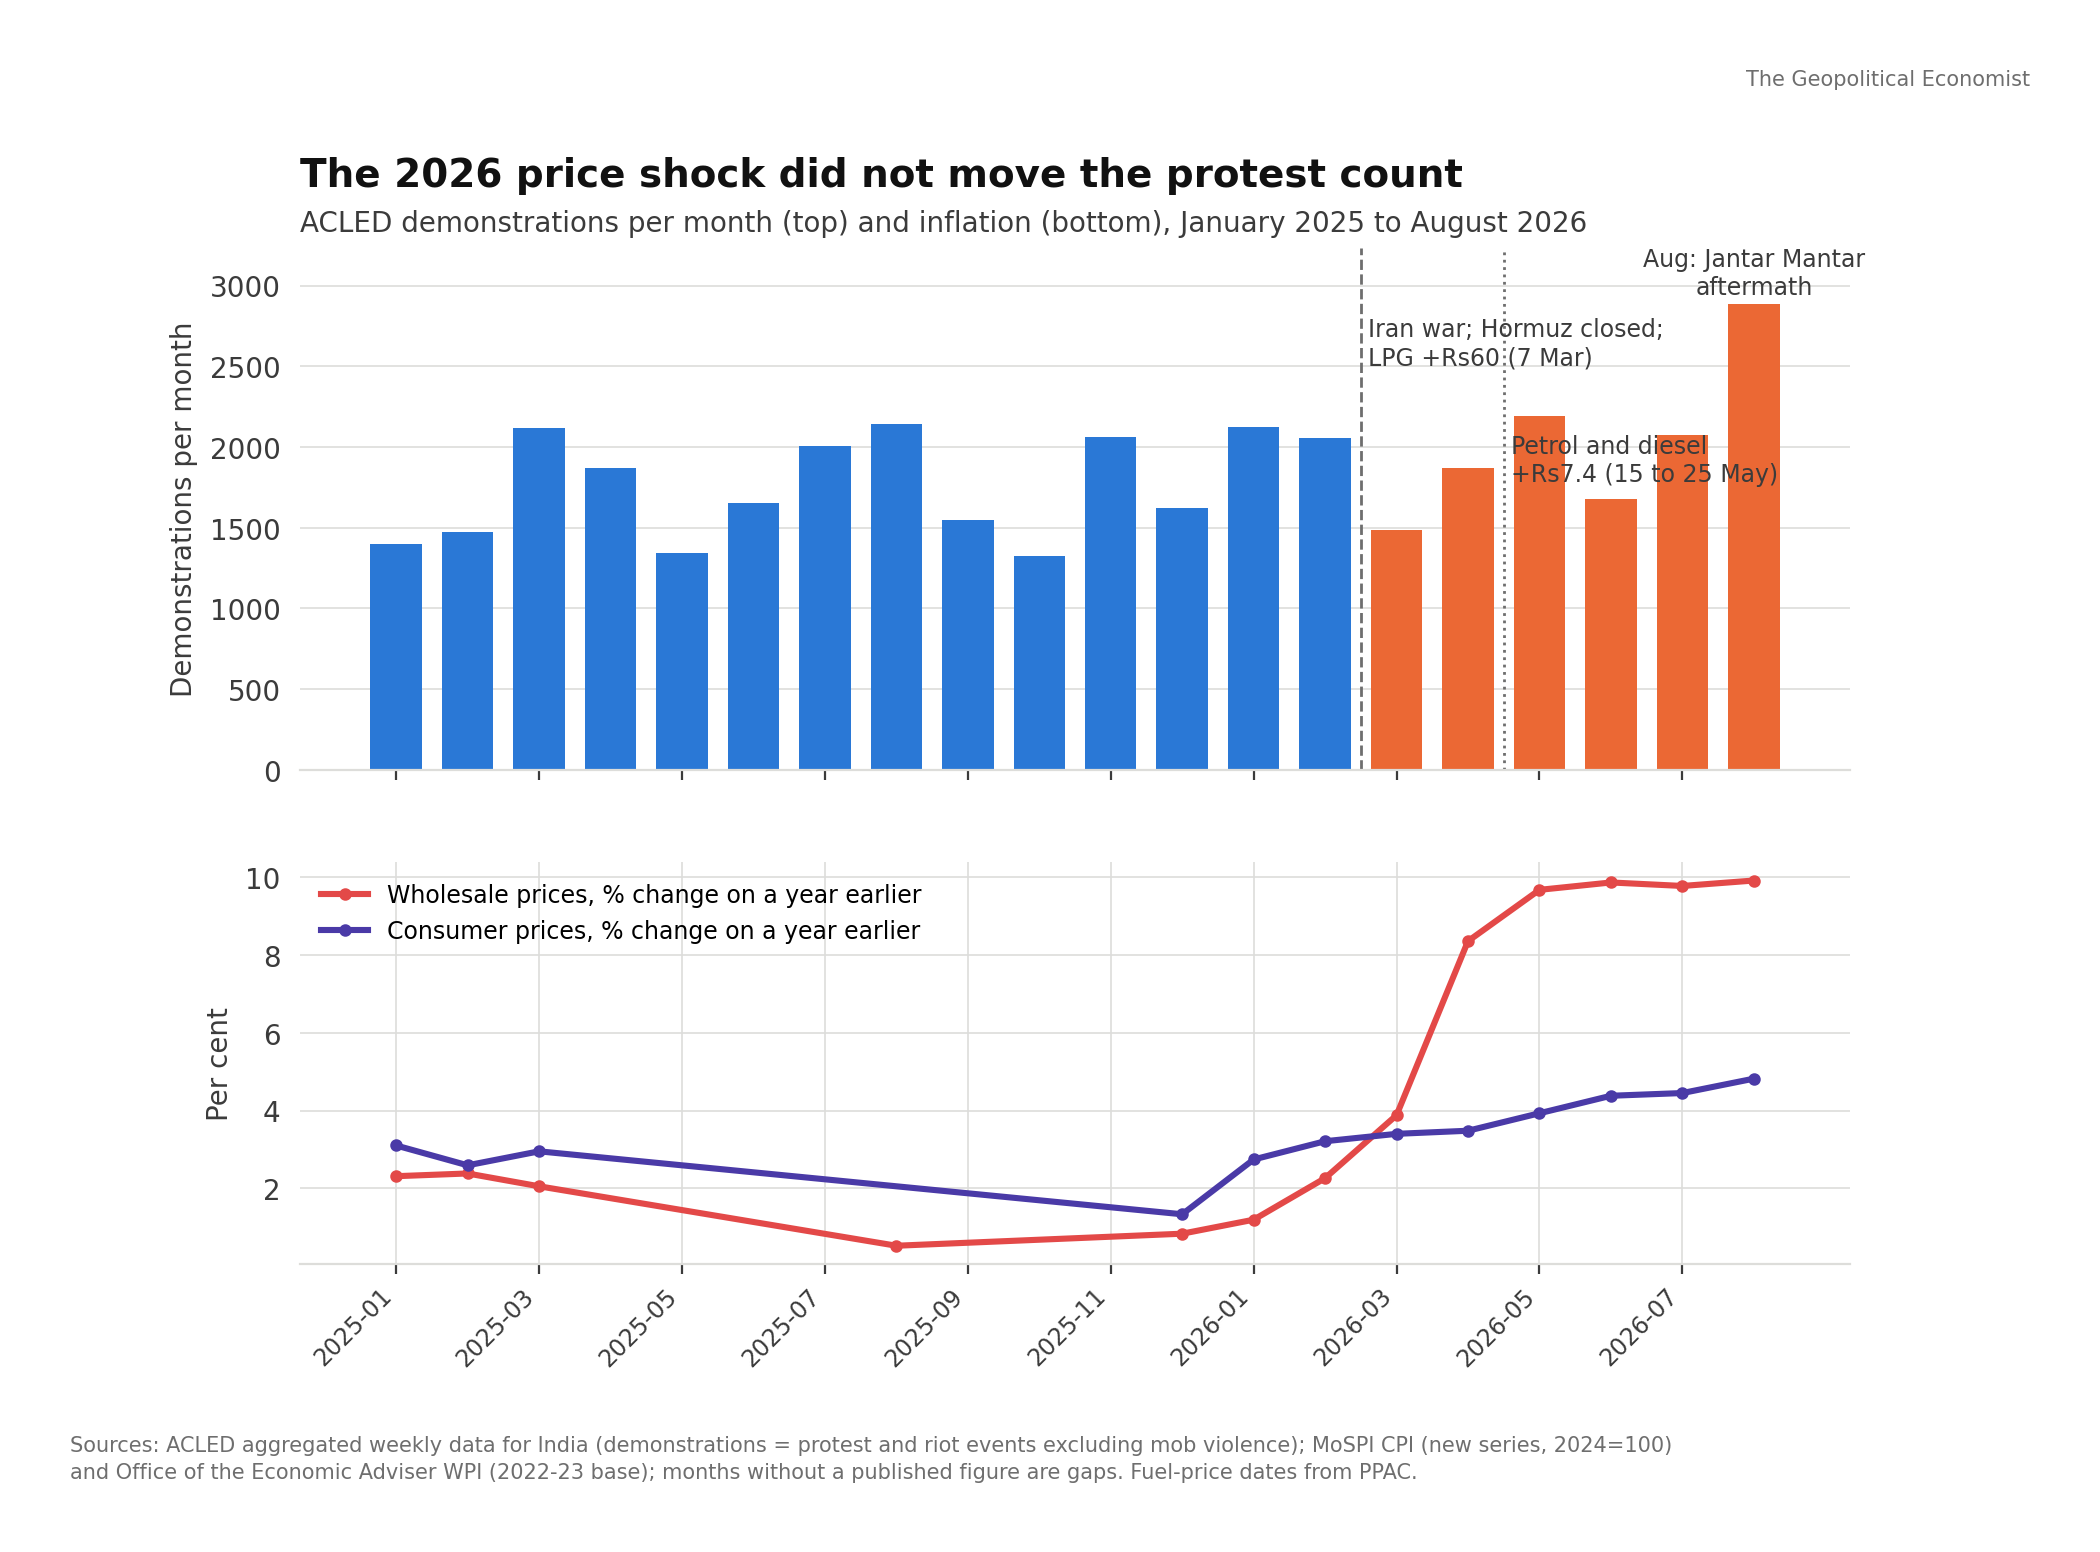
Part 2 of The Protest Question. The grievance behind India's record protest count is the state's failing examination and hiring machine, not the cost of living. The data shows where the pain is, when it erupts, and what companies operating in India should read into it.
- Part 3The money: FCRA, foreign funding and what the documents show
- Part 4The information layer: amplification, bots and the grey zone
- Part 5Case studies: CAA, the farm laws, Manipur, Ladakh, the Cockroach Janta Party
- Part 6The counter-case and the verdict
Charts
Every chart published in the series, free to reuse with attribution to The Geopolitical Economist and the sources on the chart.