
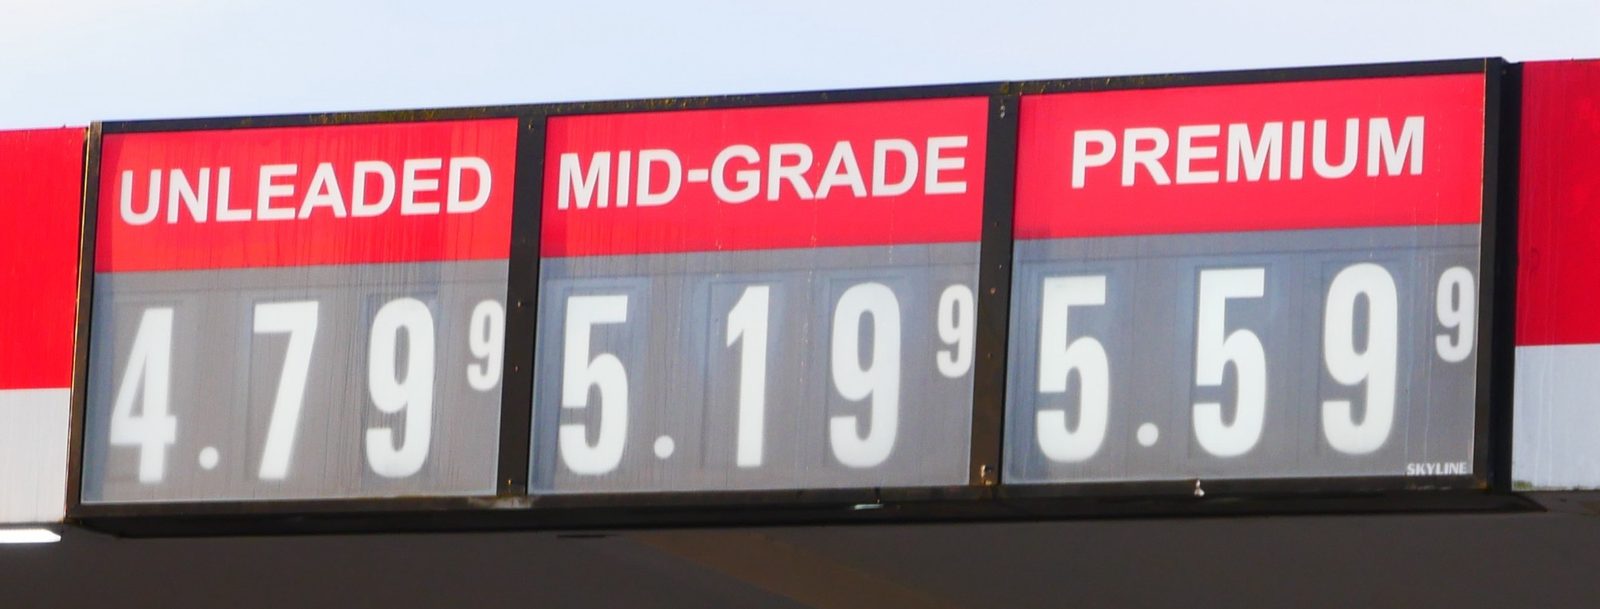
The United States remains one of the world’s wealthiest economies. But national income and aggregate spending can conceal a more immediate question: how much can households actually afford? When the cost of essentials rises faster than earnings, the issue is not inflation alone. It is whether purchasing power—and, with it, the resilience of consumer demand—is being eroded.
Prices and producer costs
September’s data sharpen that concern. The Consumer Price Index (CPI) rose 0.6 percent from August and 3.7 percent from a year earlier, according to the Bureau of Labor Statistics (BLS). Gasoline prices jumped 9.1 percent in the month and accounted for more than half of the monthly increase in the overall index. This was not a broad surge across every category: food prices were unchanged, and core inflation, which excludes food and energy, rose 0.3 percent. But energy costs can quickly affect household budgets and the cost of moving goods.
Upstream prices also climbed. The BLS Producer Price Index (PPI) rose 1.3 percent in September, its largest monthly increase since March 2022. Final-demand goods rose 2.6 percent, with energy accounting for most of that increase; final-demand services rose 0.8 percent. The annual increase in the overall PPI reached 6.3 percent, the largest since December 2022.
That does not mean every increase in producers’ costs will automatically appear on household bills. Businesses may absorb some costs in lower margins, pass some on, or adjust production and sourcing. The PPI is not a forecast of consumer inflation. Still, when energy and transportation costs rise sharply alongside consumer prices, the risk of continued pressure on household budgets becomes harder to dismiss.
Is pay keeping up?
The central test is whether pay is keeping up. In September, real average hourly earnings (wages adjusted for consumer-price changes) fell 0.5 percent from the previous month, and real average weekly earnings also declined 0.5 percent, the BLS reported. Over the year, real average hourly earnings were down 0.7 percent. Nominal hourly pay rose 0.1 percent in the month, but prices rose faster. A larger paycheck in dollar terms does not necessarily buy more.
This distinction matters because aggregate spending can look strong even as households lose ground. Census Bureau data put September retail and food-services sales at $745 billion, up 0.8 percent from August. But the estimate is not adjusted for price changes. Higher sales in dollars therefore cannot, by themselves, show that consumers bought more goods or services. With gasoline prices rising steeply, part of a household’s spending may simply cover a higher bill for the same amount of fuel.
What households expect
The strain is also visible in expectations, although the surveys measure different things and should not be treated as interchangeable. The Conference Board’s September Consumer Confidence Index initially fell 6.7 points to 81.9, with its Expectations Index at 63.6. The University of Michigan’s September consumer sentiment reading was 48.1, while one-year inflation expectations stood at 4.6 percent. These figures are snapshots of household perceptions, not direct measures of spending. Yet they suggest that many consumers remain worried about future prices and economic conditions.
Such concerns can change behavior. Households may trade down to cheaper brands, seek discounts, postpone major purchases, or cut discretionary spending. Some may bring purchases forward if they expect prices to rise further; others may wait because they are uncertain about income or borrowing costs. The effect is unlikely to be uniform. A household with savings and stable earnings has more room to adjust than one already devoting a large share of income to housing, food, transport, and debt payments.
Credit and debt
Credit data call for equal care. In August, total consumer credit grew at a 1.9 percent annual rate, while revolving credit (the category that includes credit-card borrowing) contracted at a 4.2 percent annual rate. Nonrevolving credit rose at a 4.1 percent annual rate, according to the Federal Reserve’s G.19 release. These are annualized rates of change, not year-over-year comparisons. They do not support the claim that consumers as a whole are turning increasingly to credit cards to sustain spending. Nor do they show that debt is no longer a burden: a slowdown in new borrowing says little on its own about balances already owed or the cost of servicing them.
The Federal Reserve’s 2025 Survey of Consumer Finances offers a broader household balance-sheet perspective. It found that the share of families with debt remained about 77 percent between 2022 and 2025, while the share with debt-payment-to-income ratios above 40 percent rose from 6.5 percent to 8.6 percent. These findings do not establish that inflation caused the higher debt burden, but they underline why affordability cannot be assessed from spending or credit growth alone.
What policy can do
Policy must therefore distinguish between the source of inflation and the distribution of its costs. Interest rates can restrain demand and help prevent persistent price increases, but monetary policy cannot produce more oil or repair a disrupted supply chain. At the same time, describing inflation as purely supply-driven would be too simple: prices reflect a mix of supply conditions, demand, expectations, and business decisions. Policymakers need to assess those forces rather than assume one tool can resolve them all.
A durable response should reduce vulnerability without weakening the capacity to invest and produce. That means improving the reliability and efficiency of energy and transport systems; reviewing trade measures for avoidable costs to domestic producers and consumers; and supporting productivity-enhancing investment. Targeted assistance can help low- and middle-income households facing sharp increases in essential expenses, while broad subsidies risk adding demand without addressing supply constraints. Wage growth matters too, but durable purchasing-power gains depend on productivity and inflation—not wage increases in isolation.
Beyond the spending figures
The health of the U.S. economy should not be judged only by how many dollars consumers spend. The more revealing question is whether real incomes allow households to meet basic needs, absorb shocks, and make choices without relying on unsustainable borrowing. September’s figures do not prove that consumption is about to collapse. They do show why nominal spending can give a misleading account of household well-being when prices rise faster than pay.
If that gap persists, the consequences will reach beyond individual budgets. Consumption is a major engine of the U.S. economy, but it cannot expand indefinitely on the strength of higher prices and thinner purchasing power. The deeper challenge is to restore households’ ability to buy—not merely to keep them spending.
Sources: BLS: Consumer Price Index, September 2026 · BLS: Producer Price Index, September 2026 · BLS: Real Earnings, September 2026 · US Census Bureau: Monthly retail trade · The Conference Board: Consumer Confidence Index · University of Michigan: Surveys of Consumers · Federal Reserve: G.19 Consumer Credit · Federal Reserve: 2025 Survey of Consumer Finances (9 October 2026).
Related: US Inflation Is Surging: An Alarm for the Global Economy? · LCT and Dollar Face-Off


Comments
No comments yet. Be the first.
Comments are closed on this article.